Figure 5.
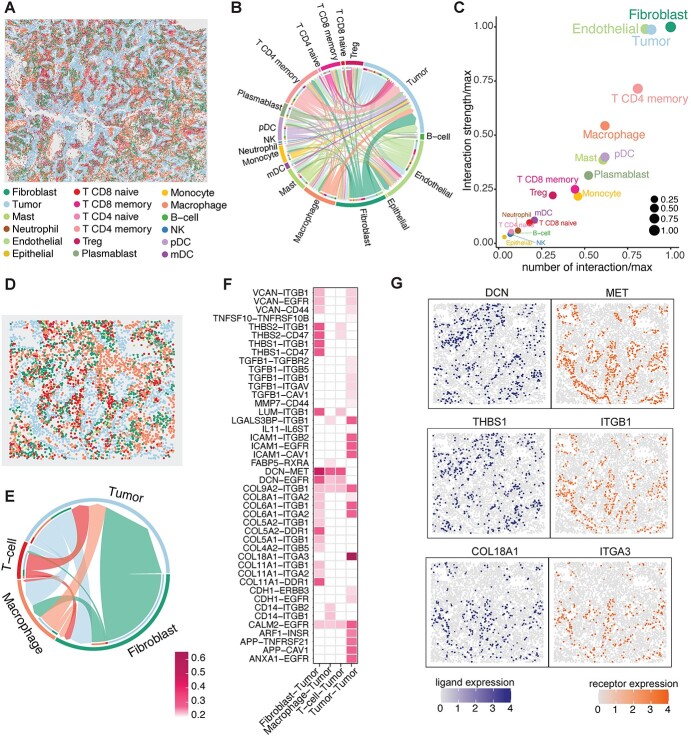
spaCI reveals strong interactions from fibroblasts to tumours in the lung cancer microenvironment. (A) The spatial plot of 81 236 cells from the 20 FOVs of NanoString CosMx SMI dataset. (B) Summary chord diagram of the identified cell–cell communication network. The chord width is proportional to the interaction strength across different cell types. (C) The scatter plot shows the involved number of L–R interactions and the interaction strength for each cell type. To keep the x-axis and y-axis at the same scale, we divide the value, i.e. the number of interactions (x-axis) and interaction strength (y-axis), by their maximums respectively. (D) The spatial plot of cells within the FOV comprising abundant fibroblast and tumours. (E) Summary chord diagram of the cell–cell communication network of major cell types. The chord width is proportional to the interaction strength. (F) Heatmap shows the identified L–R interactions between major cell types and tumour cells. (G) Spatial plots of the expressions of identified L–R interaction pairs.

