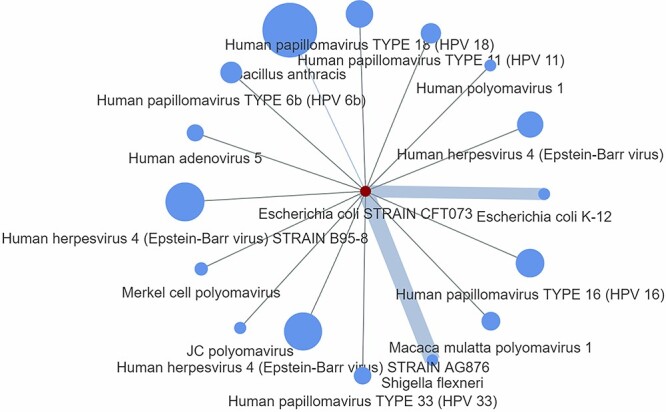
Figure 2.

A P2P network showing the E. coli STRAIN CFT073 pathogen (depicted with red colour) along with its first neighbours. The node size represents the number of host proteins related to a specific pathogen, and the edge size represents the edge score obtained by means of Equation (1).
