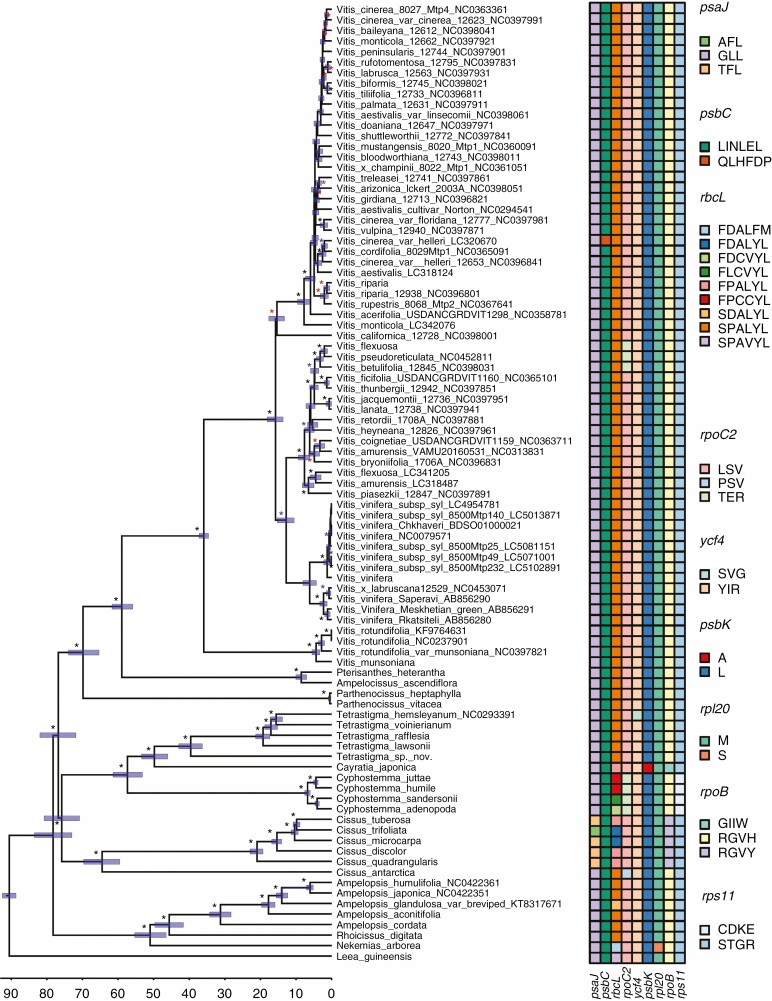
Fig. 1.
Divergence times of the main lineages of Vitaceae based on non-coding plastid DNA and estimated using BEAST 1.10.2. Black, blue and red asterisks represent bootstrap values >90, >75 and >50 respectively. The scale at the bottom of the figure is reported in millions of years before the present while blue bars represent the associated credibility interval (95 % HPD). The character data matrix drawn next to the tips of the tree shows the distribution of character states across the nine genes identified by both aBSREL and BSM methods (columns) and the species analysed (rows). For any given gene, the character states were defined by the sequence of amino acids found corresponding to the codons that were under episodic positive selection. Cells in the matrix were coloured based on the character states identified in each gene and character states were named using the appropriate combinations of the amino acid one-letter code. For example, in the case of the psaJ gene, three codons were under positive selection, resulting in three different character states: AFL (i.e. first codon: alanine; second codon: phenylalanine; third codon: leucine), GLL (i.e. first codon: glycine; second codon: leucine; third codon: leucine) and TFL (i.e. first codon: threonine; second codon: phenylalanine; third codon: leucine). In the case of a synonymous mutation, the same amino acid was used to encode character states, as in the case of the third codon of the psaJ gene. Physical positions of amino acids under selection relative to their alignment are given in Table 2. Gene names and colours used to represent different character states in each gene are given in the figure.

