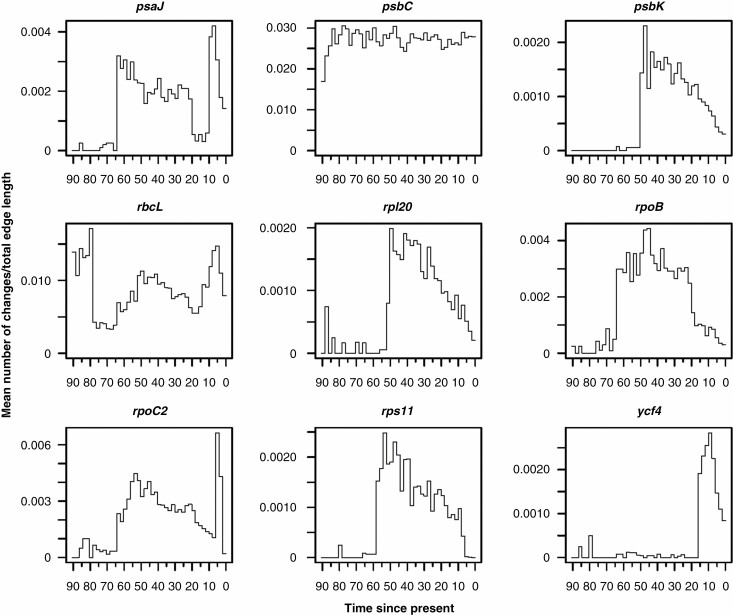
Fig. 2.
Changes through time plots generated from sampled stochastic character maps for the nine genes found to be under episodic positive selection by both aBSREL and BSM methods. For each gene the mean rate of changes per unit time is shown. Gene names are given above plots and time is expressed in millions of years since the present.

