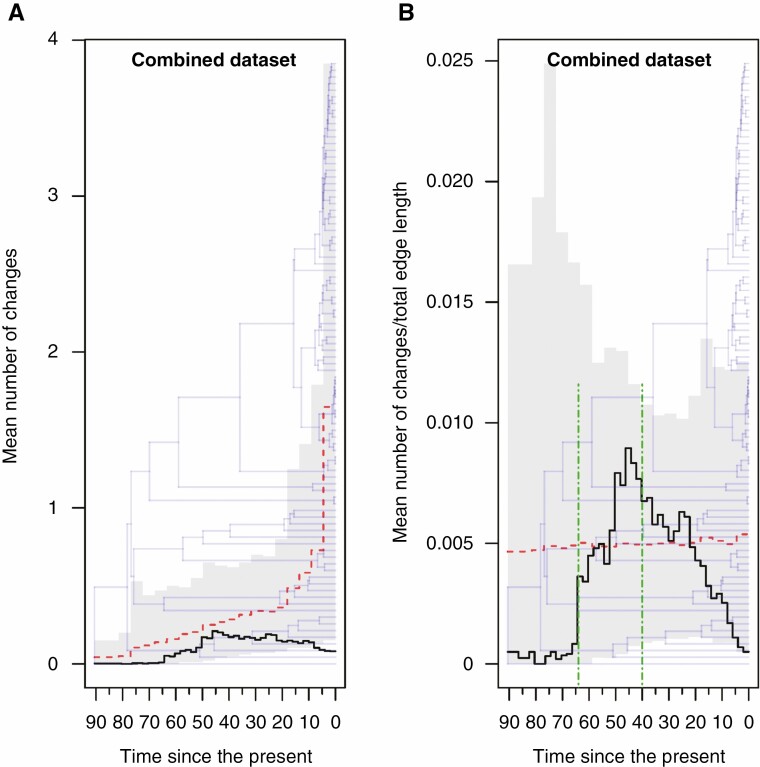
Fig. 4.
Changes through time plots generated from sampled stochastic character maps for the combined character (i.e.information from the psaK, rpl20, rpoB and rps11 genes). Time is measured in millions of years since the present. (A) The sampled mean number of changes per unit time (black line), the expected mean (red dashed line) and the expected 95 % distributions under the null model (grey shading) are superimposed on the reference chronogram obtained from BEAST. (B) The sampled mean rate of changes per unit time (black line), the expected mean (red dashed line) and the expected 95 % distributions under the null model (grey shading) are superimposed on the reference chronogram obtained from BEAST. The two epoch boundaries applied in the tested ML three-epochs model (see main text for details) are indicated by dot dash vertical green lines drawn at 64 and 40 Ma, respectively.

