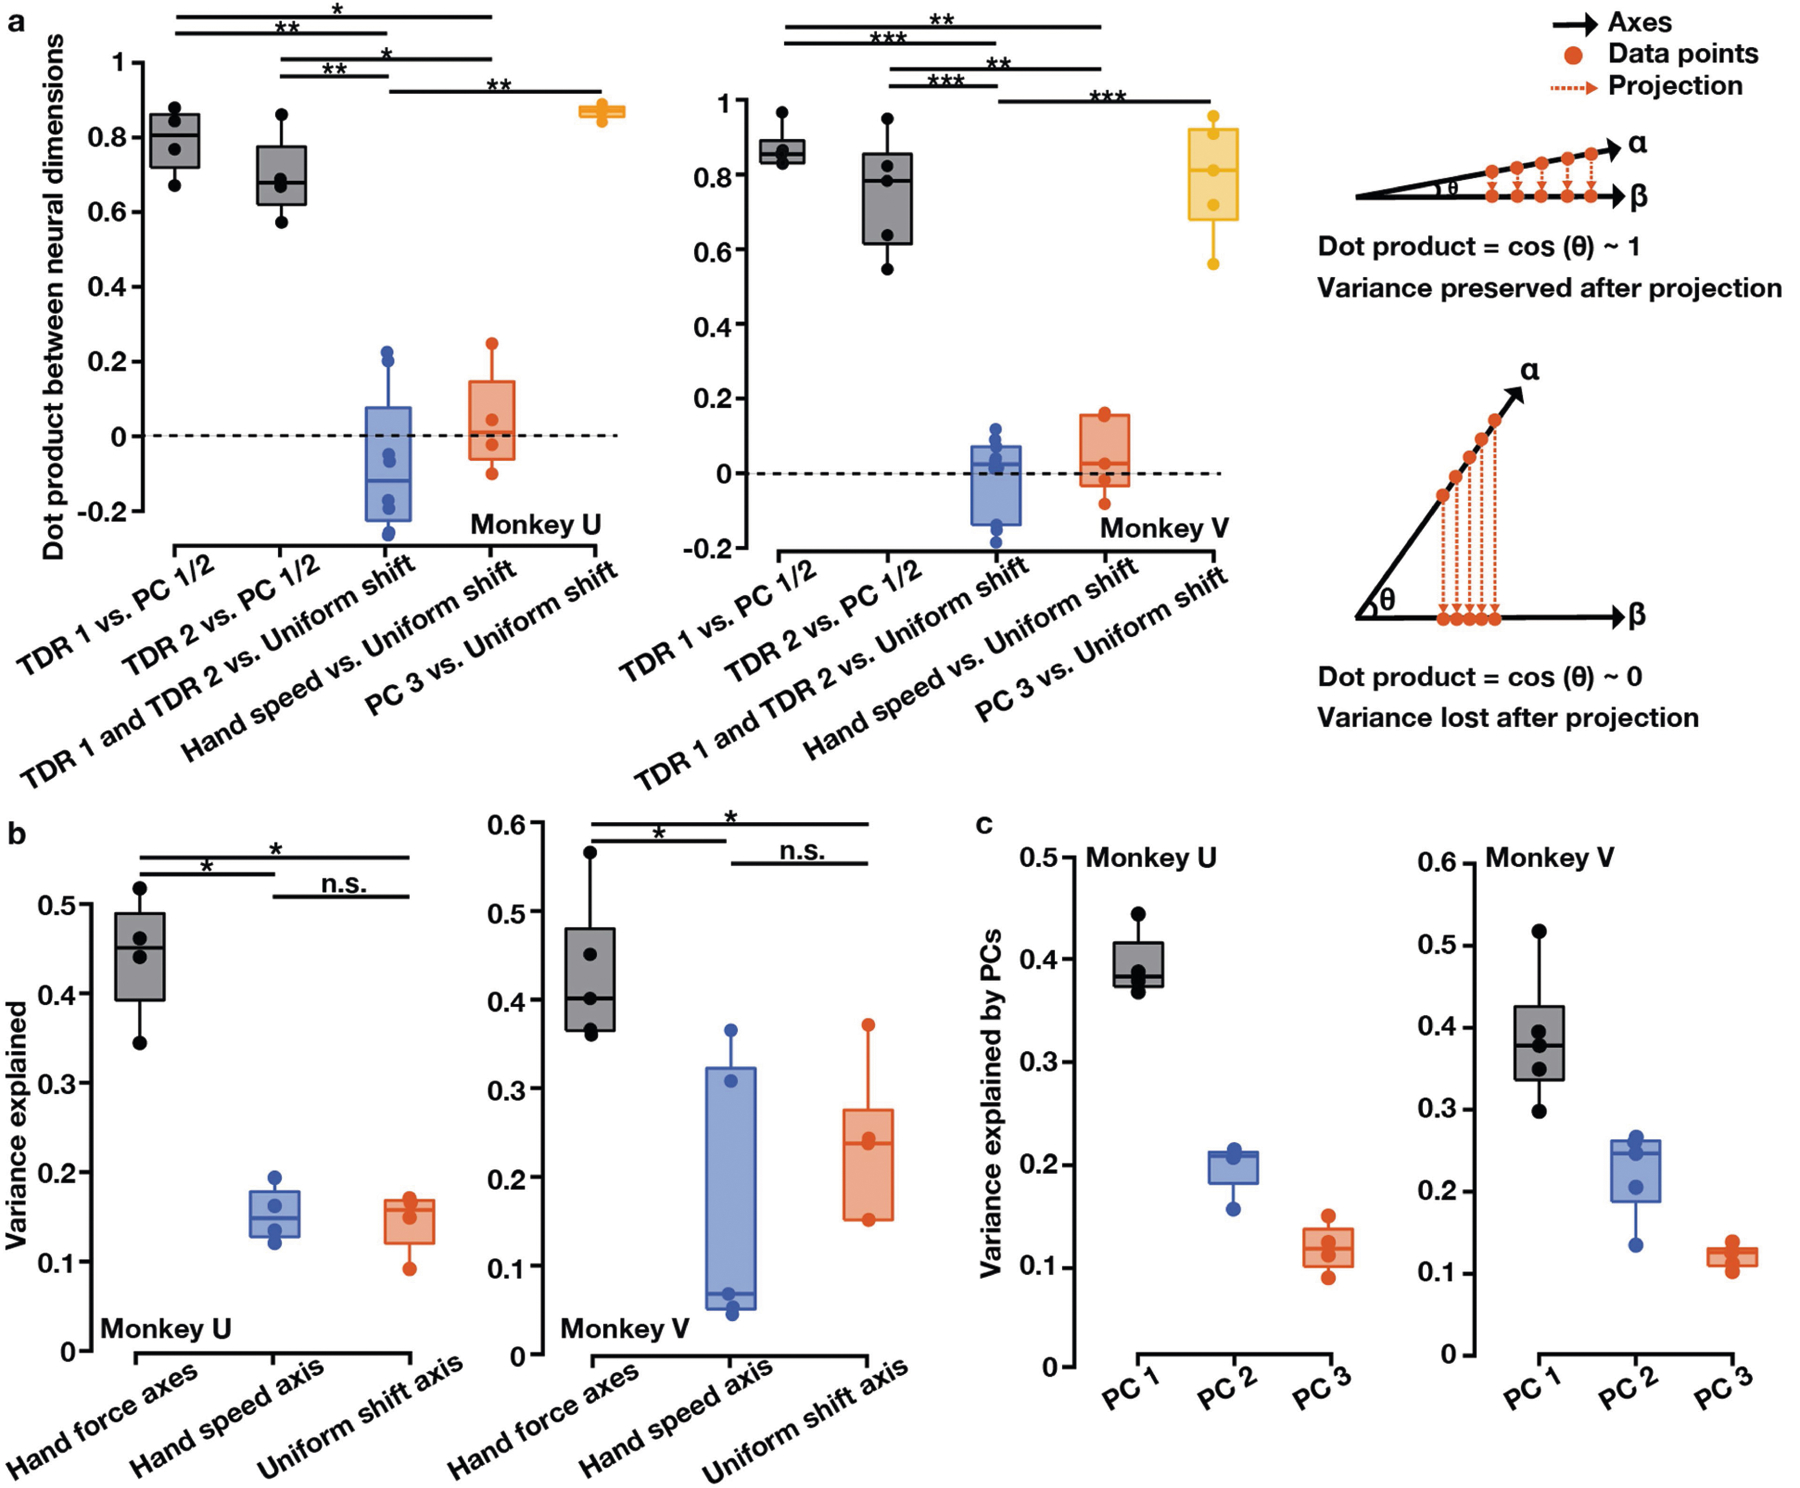
Extended Data Fig. 3 |. Relationships between neural population dimensions and total neural variance explained by different dimensions.

a, Pairwise dot products between neural population dimensions. Values close to 1 indicate that two dimensions are closely aligned and values close to 0 indicate that two dimensions are nearly orthogonal. In each session, we calculated the dot product of TDR 1 and PC 1 and the dot product of TDR 1 and PC 2, and took the larger value of the two dot products (TDR 1 vs. PC 1 / 2). We then calculated the dot product of TDR 2 and the PC axis not used for multiplying with TDR 1 (TDR 2 vs. PC 1 / 2). The PC 1 / 2 plane largely overlapped with the TDR 1 / 2 plane (black). The TDR 1, TDR 2, and hand-speed TDR axes were all nearly orthogonal to the uniform-shift learning axis (blue and red). PC 3 largely overlapped with the uniform-shift learning axis (yellow). Two-sided Wilcoxon rank-sum test: monkey U, **P = 4.04 × 10⁻³, *P = 0.029; monkey V, ***P = 6.66 × 10⁻⁴, **P = 7.94 × 10⁻³. Right panel: a schematic illustration of projecting data points from axis α to axis β and the corresponding dot product. b, c, The portion of total neural activity variance explained by the TDR 1 and TDR 2 (hand force) axes, hand-speed TDR axis, uniform-shift axis and PCs 1–3. b, Two-sided Wilcoxon rank-sum test: monkey U, *P = 0.029, n.s. P = 1; monkey V, *P = 0.016 and 0.032, n.s. P = 0.42. a–c, n = 4 (monkey U) and n = 5 (monkey V). For all the box plots, the central line indicates the median, the bottom and top edges indicate the 25th and 75th percentiles of the data, and the whiskers extend to the 5th and 95th percentiles of the data.
