
Extended data 1. Generation of Tcf7l2 mutant rats.
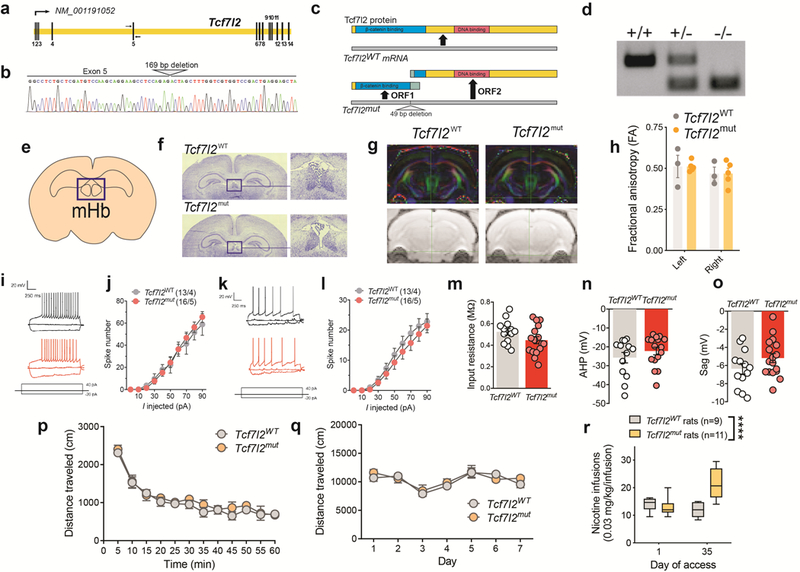
a, Schematic of the Rattus norvegicus Tcf7l2 gene. Exons are spliced to generate Tcf7l2 mRNA (NCBI Reference Sequence: NM_001191052.1). Primers for genotyping and Sanger sequencing are indicated by arrows flanking exon 5. b, Sequencing chromatograph of the Tcf7l2 mutant allele. The site of the 169 bp deletion from exon 5 and the following intron is labelled. c, Illustration of Tcf7l2 wild-type protein, containing an N-terminal β-catenin binding domain (blue) and C-terminal DNA binding domain (red). Predicted open reading frames and truncated proteins generated from the Tcf7l2 mutant mRNA. Green regions on predicted truncated proteins denote ectopic amino acid sequences not found in wild-type Tcf7l2 protein. d, Genotyping of Tcf7l2WT and Tcf7l2mut rats: wildtype animal (+/+) with single band at 304 bp; heterozygous animal (+/−) with bands at 304 and 144 bp; and mutant animal (−/−) with a single band at 144 bp. Image is representative of genotyping results obtained for Tcf7l2WT and Tcf7l2mut rats used each experiment. e, Graphical representation of mHb in coronal slice of rat brain. Image adapted from the Allen Brain Reference Atlas. f, Nissl staining showed similar mHb volumes in Tc7l2WT and Tcf7l2mut rats. Image is representative of results obtained in 3 biologically independent animals from each genotype. g, Diffusion tensor imaging (DTI) tractography of the fasciculus retroflexus in Tcf7l2WT (n=3) and Tcf7l2mut (n=5) rats. h, Fractional anisotropy (FA) (± s.e.m.) showed bilateral similar integrity (left and right sides) of the fasciculus retroflexus in Tcf7l2WT (n=3) and Tcf7l2mut (n=5) rats; Genotype: F (1, 6)=0.000003; P=0.99; Brain side: F (1, 6) = 2.562, p=0.16; Genotype x Brain side: F (1, 6) = 0.0007, p=0.98. i, The frequency at different steps of positive current used to calculate the slope of the input-output curve from dorsal mHb neurons. Example traces showing typical current steps at −20, 0 and 40 pA in dorsal mHb neurons from Tcf7l2WT, and Tcf7l2mut rats. j, Input-output curve (mean ± s.e.m.) in dorsal mHb neurons from Tcf7l2WT, and Tcf7l2mut (n=16 cells from 5 rats) rats. k, The frequency at different steps of positive current used to calculate the slope of the input-output curve from ventral mHb neurons. l, Input-output curve (mean ± s.e.m.) in ventral mHb neurons from Tcf7l2WT and Tcf7l2mut (n=16/5) rats. m, Input resistance (mean ± s.e.m.) from mHb neurons from Tcf7l2WT (13 cells from 4 rats) and Tcf7l2mut (16/5) rats; p=0.1036, unpaired two-tailed t-test. n, Afterhyperpolarization (mean ± s.e.m.) in mHb neurons from Tcf7l2WT (13/4) and Tcf7l2mut (16/5) rats; P=0.3043, unpaired two-tailed t-test. o, Sag current (mean ± s.e.m.) in mHb neurons Tcf7l2WT (13/4) and Tcf7l2mut (17/5) rats; p=0.1386, unpaired two-tailed t-test. p, Total distance traveled (mean ± s.e.m.) by drug-naive Tcf7l2WT (n=6) and Tcf7l2mut (n=5) rats during a 60 min session. q, Total distance traveled (mean ± s.e.m.) by Tcf7l2WT (n=6) and Tcf7l2mut (n=5) rats after daily saline or nicotine (0.4 mg kg−1) injections (15 min pretreatment time). r, Responding for the training dose of nicotine (0.03 mg/kg/inf) (mean ± s.e.m.) was assessed in a group of Tcf7l2WT (n=9) and Tcf7l2mut (n=11) rats on day 1 and day 35 of access. Nicotine responding was similar between the of Tcf7l2WT and Tcf7l2mut rats on day 1 of access, but Tcf7l2mut rats escalated their intake such that such that there responding was higher that on day 35 compared with Tcf7l2WT rats, and compared with their own intake on day 1 (F(1, 18) = 30.8, ****p<0.0001, interaction effect between Genotype and Session in two-way ANOVA). Box plot shows min-max range.