Figure 3.
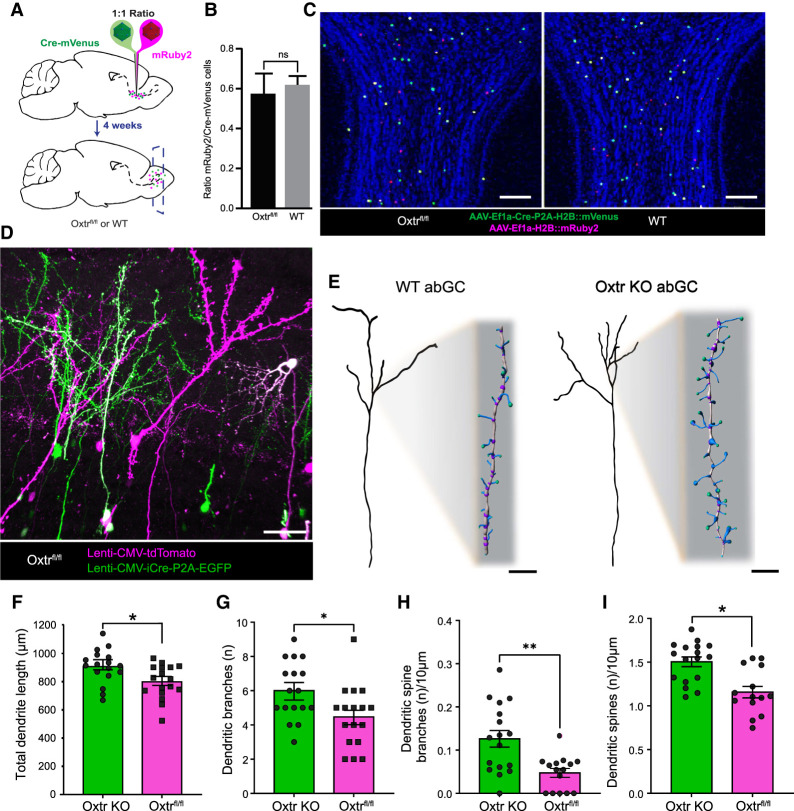
Selective Oxtr knockout in developing abGCs yields larger and more complex dendritic arbors with increased spine densities. (A) Schematic diagram of a knockout experiment. (Cre-mVenus) AAV DJ8-Ef1a-Cre-P2A-H2B::mVenus, (mRuby2) AAV DJ8-Ef1a-H2B::mRuby2. (B) Quantification of data derived from C. Student's t-test, P > 0.05. n = 4/group. (C) Coronal view of OB 4 wk after RMS lentivirus injection outlined in A. Scale bar, 200 μm. (D) Representative confocal image for 3D reconstruction. Lenti-CMV-tdTomato and Lenti-CMV-GFP-Cre-P2A-EGFP. Scale bar, 30 μm. (E) Flattened representation of WT and Oxtr KO abGCs. Scale bar, 10 μm for inset magnified spines. (F–I) Quantification of total dendritic morphology. Student's t-test, (*) P < 0.05, (**) P > 0.005. nKO = 17 cells, nKO = 4 animals, nFlox = 17cells, nFlox = 5 animals.

