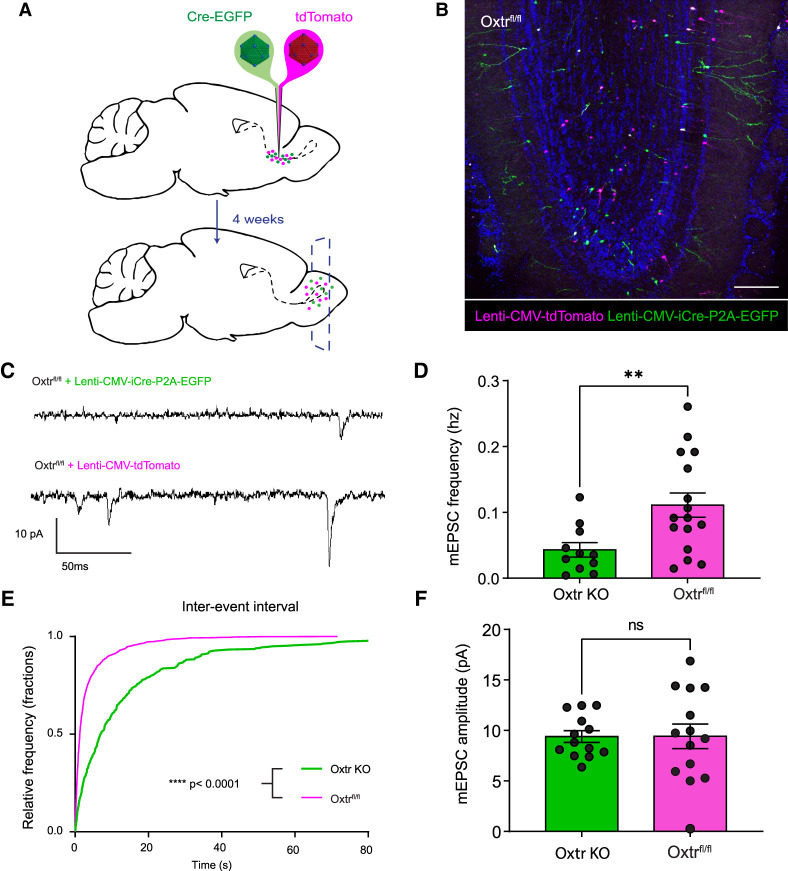
Figure 4.
Oxtr KO in abGCs results in lower frequency of mEPSCs. (A) Schematic diagram of lentiviral injections into Oxtrfl/fl animals. (B) Representative coronal slice 4 wk after lentiviral RMS injection. Scale bar, 150 μm. (C) Representative miniature excitatory postsynaptic current trace of Oxtr KO and Oxtr Flox/WT cells. (D) Frequency of miniature excitatory postsynaptic current. Students t-test P < 0.05. NOxtr KO = 6 animals, NOxtr KO = 12 cells, NWT = 7 animals, NWT = 20 cells. (E) Interevent interval graph. Kolmogorov-Smirnov test, P < 0.0001. NOxtr KO = 6 animals, NOxtr KO = 11 cells, NWT = 7 animals, NWT = 10 cells. (F) Graph of miniature excitatory postsynaptic current amplitude. Students t-test, P > 0.05. NOxtr KO = 6 animals, NOxtr KO = 14 cells, NWT = 7 animals, NWT = 14 cells.

