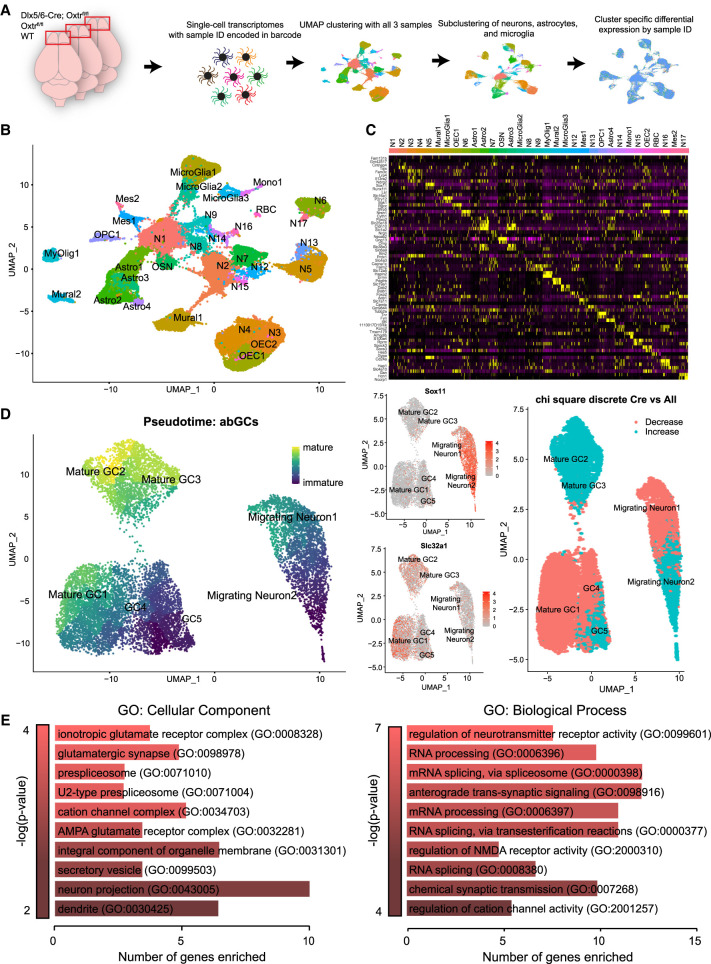
Figure 5.
Single-cell sequencing of Oxtr KO and Oxtr WT OBs demonstrates transcriptional changes associated with synapse morphology and formation within abGCs. (A) Schematic diagram for 10X Chromium single-cell sequencing workflow. (B) Uniform manifold projection of all OB cells. Dlx5/6-Cre;Oxtrfl/fl, Oxtrfl/fl, and WT samples clustered concurrently. (C) Heat map of the top differentially expressed genes for each cluster in B. (D, left) Uniform manifold projection of subclustered abGCs colored in pseudotime. (Middle) Expression of Sox11 and Slc32a1 maturation markers mapped onto abGC clusters. (Right) χ2 analysis of Dlx5/6-Cre;Oxtrfl/fl cluster composition versus WT and Oxtrfl/fl samples. (E) Differential expression GO analysis from just abGCs adapted from EnrichR.

