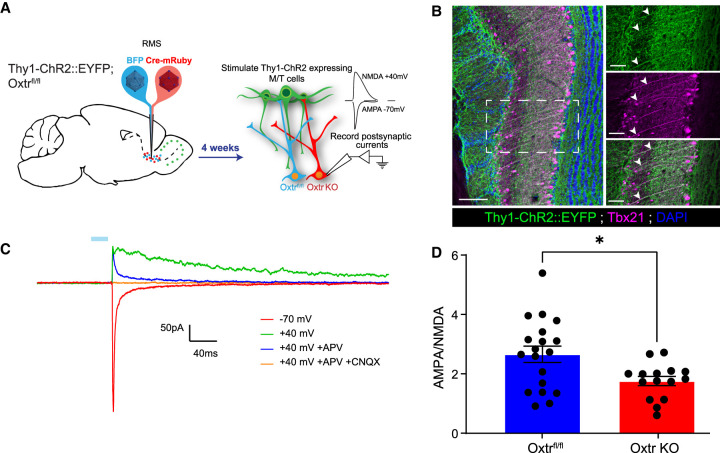
Figure 7.
Oxtr knockout in developing abGCs reduces the functional AMPA:NMDA ratio from mitral/tufted cells. (A) Schematic diagram of experimental setup using the Thy1-ChR2:EYFP transgenic allele. (B, left) Coronal slice of the OB demonstrating expression of Thy1-ChR2::EYFP. Scale bar, 100 µm. (Top right) Magnified image derived from the white box. Scale bar, 50 µm. (Middle right) Coronal slice of the OB demonstrating expression of Tbx21. Scale bar, 50 µm. (Bottom right) Magnified image derived from the white box. Note the white arrowheads denoting colocalization. Scale bar, 70 µm. (C) Representative trace from the visually guided whole-cell patch clamp experiment. The blue bar represents 470-nm LED stimulation. (APV) Selective NMDAR antagonist, (CNQX) selective AMPAR antagonist. (D) Graph of the AMPA:NMDA ratio. Students t-test, P = 0.0272. nFlox = 5 mice, nFlox = 19 cells, nKO = 4 mice, nKO = 15 cells.

