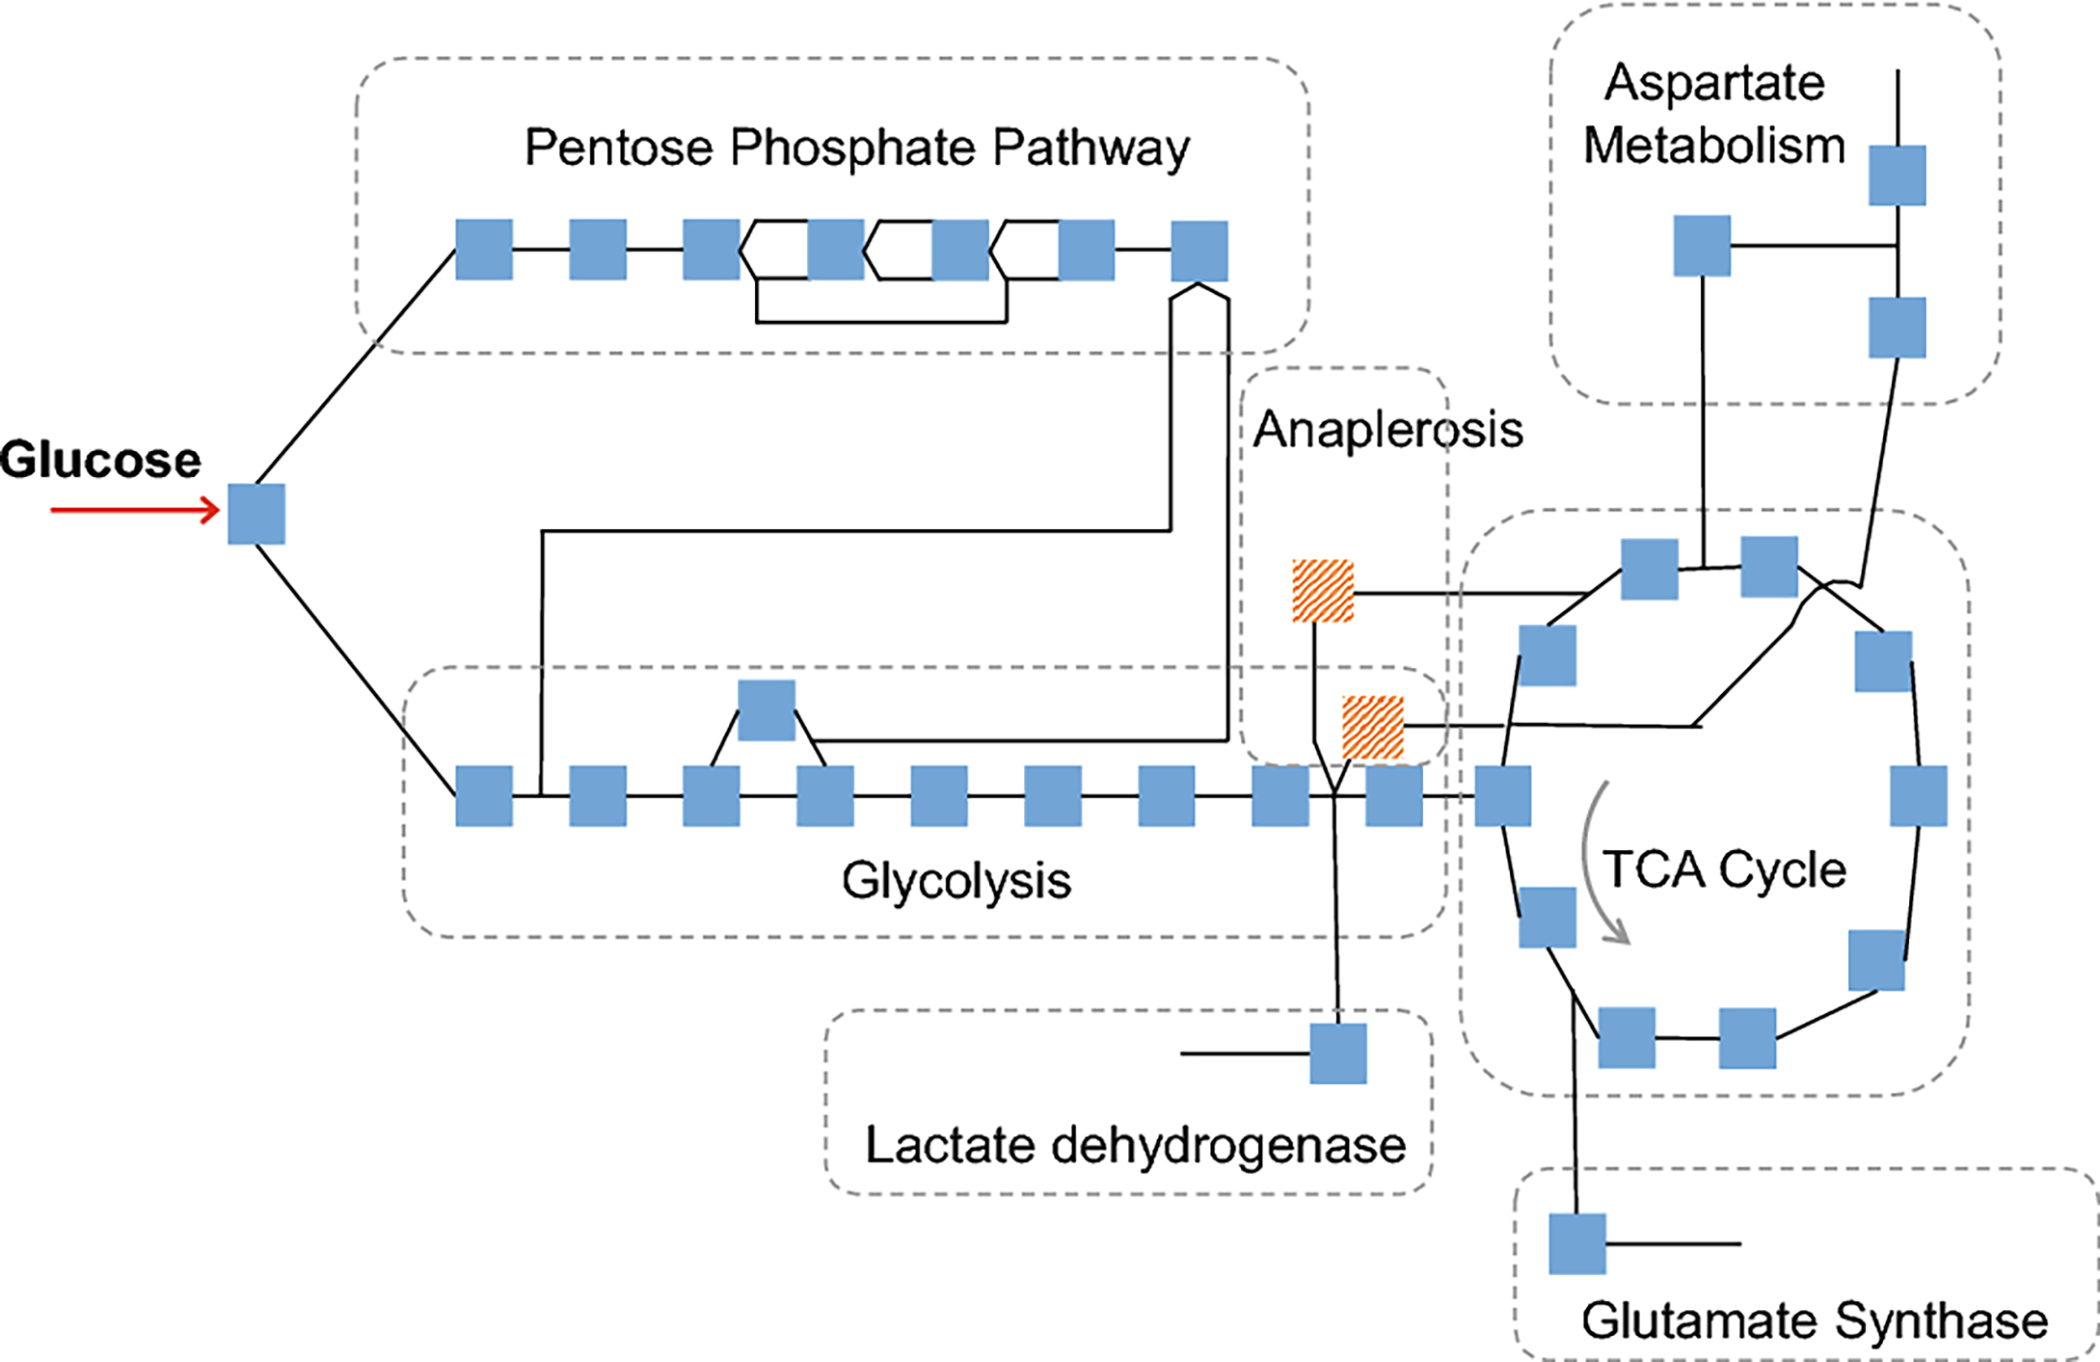
Fig. 1.

Map of central energy metabolism. Each square represents a modeled reaction, and lines represent metabolites, most of which are detected experimentally. Pathways included are glycolysis, pentose phosphate pathway, and the citric acid cycle (with anaplerotic reactions shown in red), and reactions in aspartate, glutamine, and lactate metabolism that share metabolites with these pathways. Electron transport chain reactions not shown for simplicity, but are included in the model.
