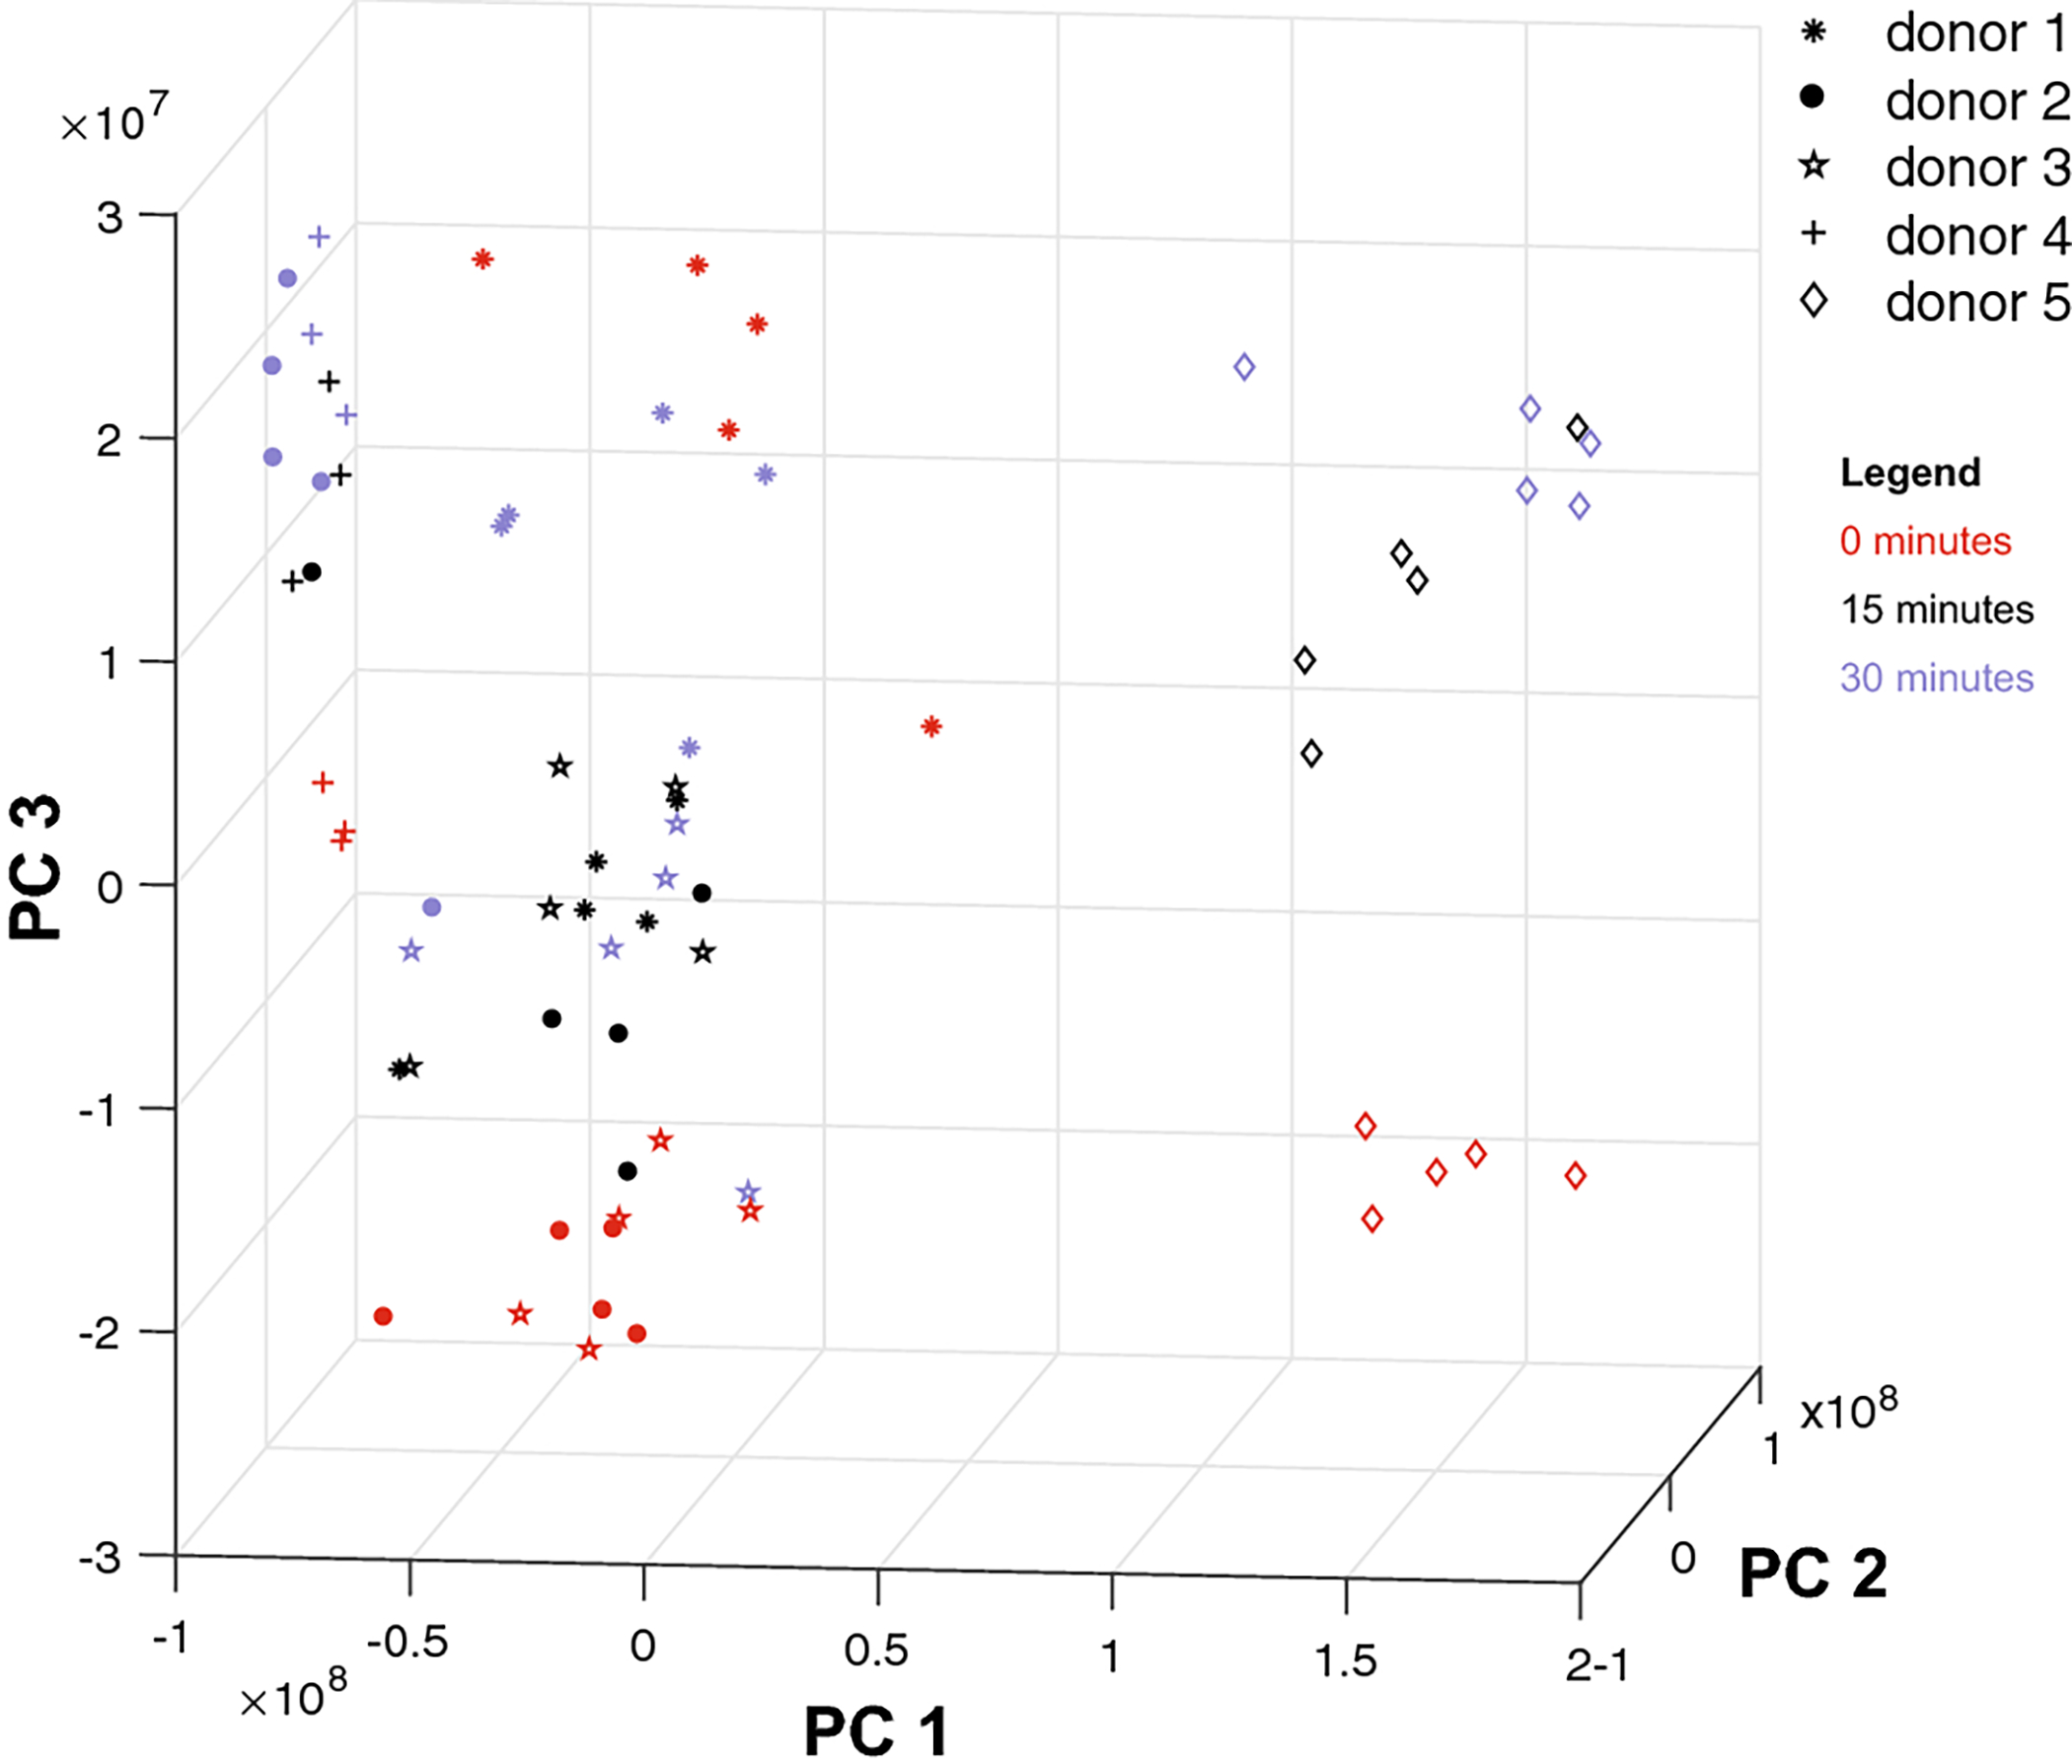
Fig. 2.

Principal components analysis of donor data. Each point represents a sample (associated with a donor and time of compression and composed of 37 measurements) after projection onto the three principal axes of variation. Red, black, and blue samples have been compressed for 0, 15, and 30 minutes, respectively. PC1 (88% variation explained) captures the differences between donor 5 and the rest of the donors; PC2 (9%) and PC3 (3%) capture the variation between donors and across compression time. PC3 especially is associated with the direction of change across time. Samples compressed for a longer time are higher along axis PC3 than those compressed for a lesser time, if they are from the same donor.
