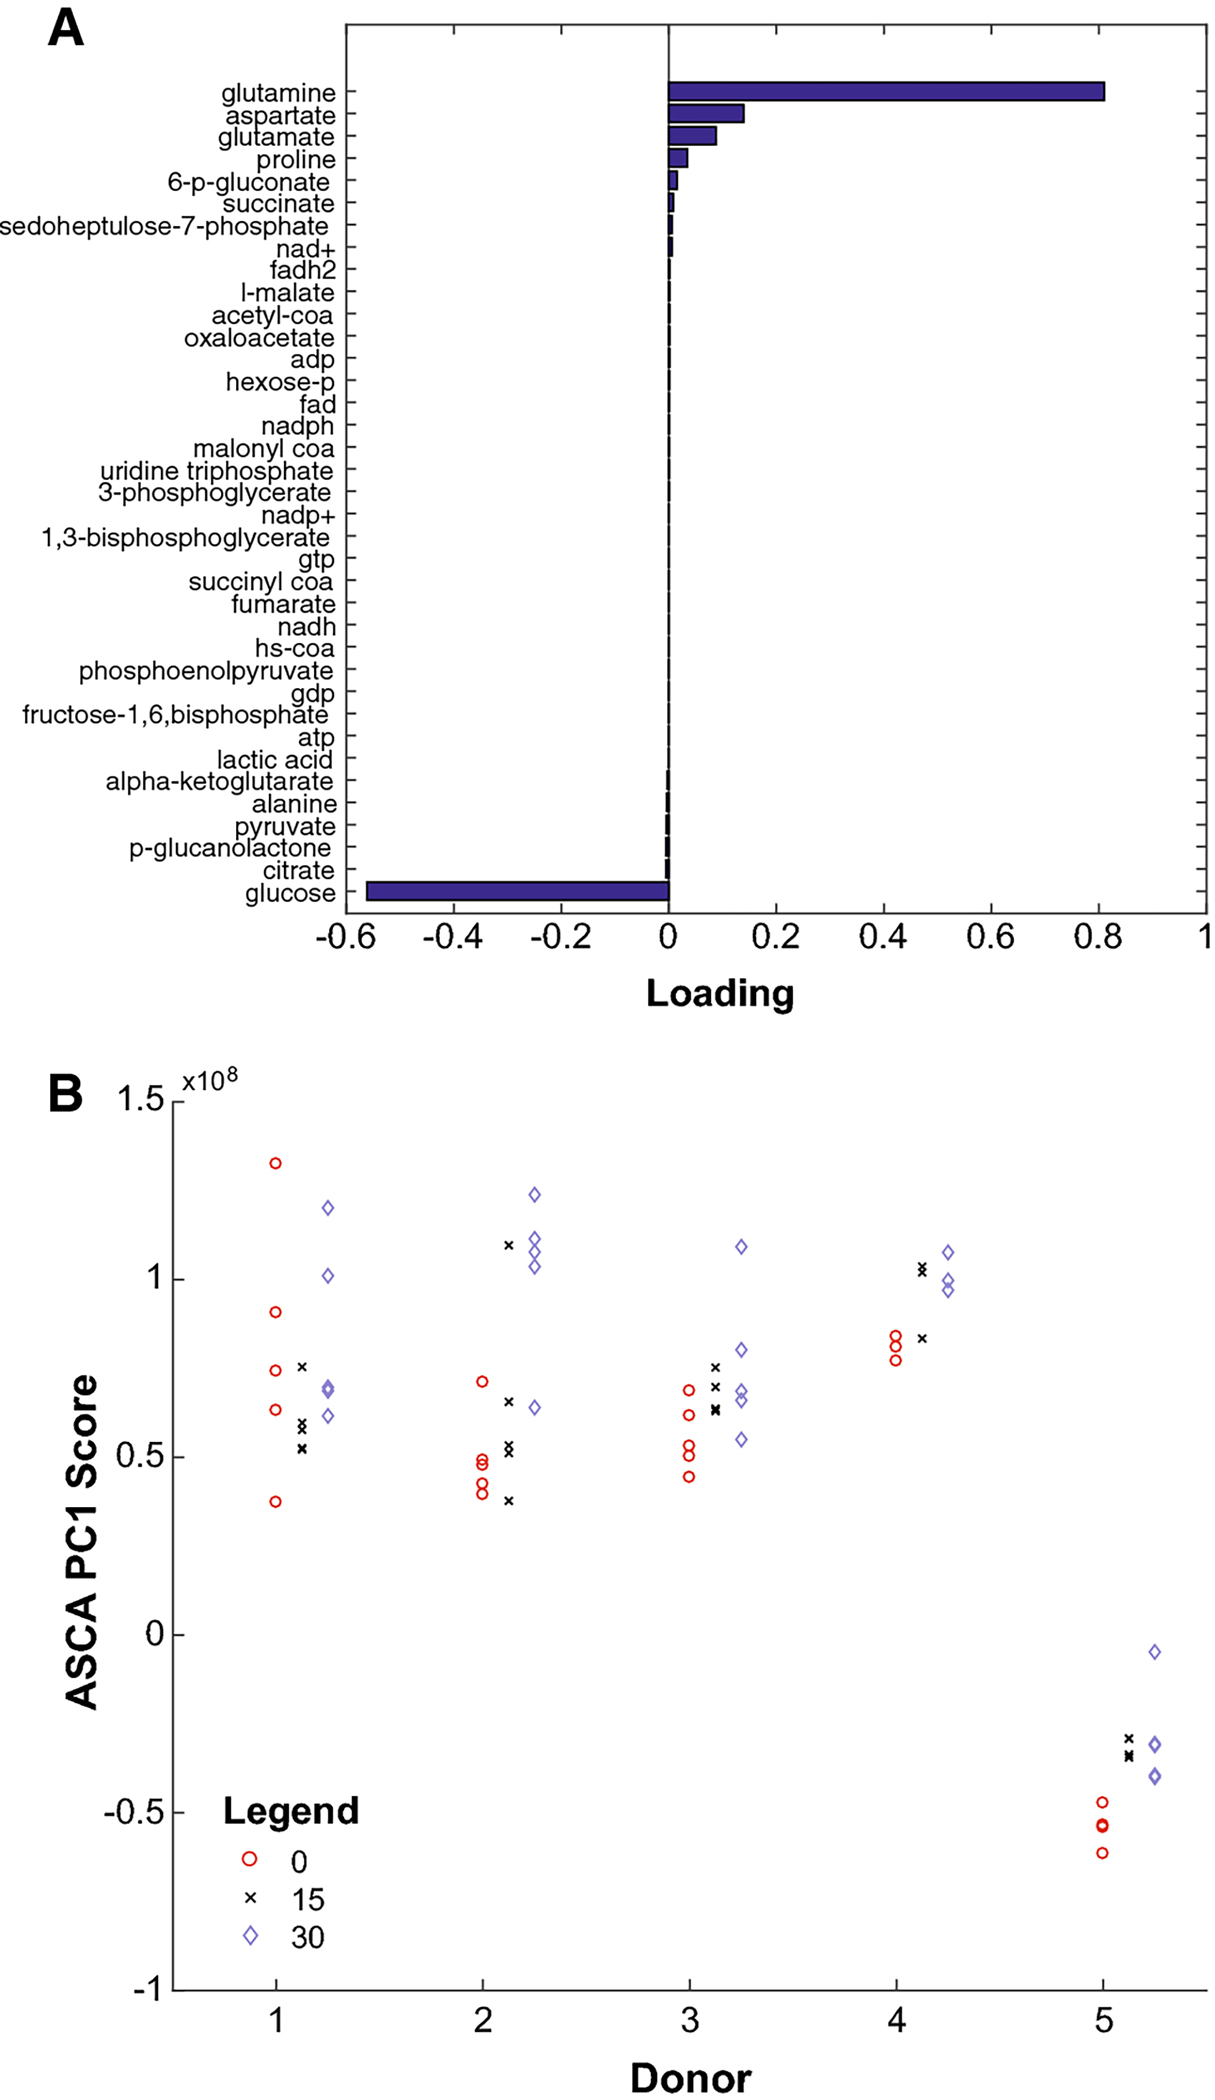
Fig. 4.

(A) Loading for each metabolite along the first principal component computed by ANOVA-Simultaneous Components Analysis (ASCA PC1), sorted from least (bottom) to greatest (top). (B) Data for donors 1–5 after projection onto ASCA PC1 (vertical dimension). Red, black, and blue samples represent samples compressed for 0, 15, and 30 minutes, respectively. Compressed samples tend toward the top, obtaining higher ASCA PC1 scores.
