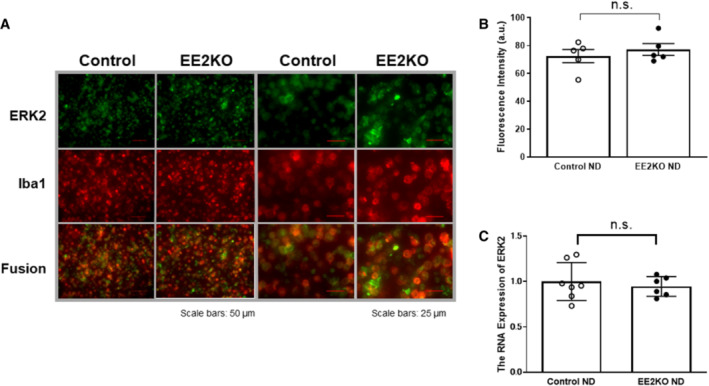
Figure 2. ERK2 expression levels of macrophage from peritoneal cavity and bone marrow between control and EE2KO.

A, Double immunohistochemistry of macrophage from peritoneal cavity with anti‐ERK2 antibody (green) and anti‐ionized calcium‐binding adapter molecule‐1 (Iba1) antibody (red). Scale bar is 50 μm (left) and 25 μm (right). B, Fluorescence intensity of ERK2 in macrophage (n=5 per each group). C, The RNA expression of ERK2 in bone marrow (Control‐ND, n=7; EE2KO‐ND, n=6). Error bars represent SEM. Between‐group differences were compared by Student t test. a.u. indicates arbitrary unit; EE2KO, endothelial‐specific extracellular signal‐regulated kinase 2 knockout; ERK, extracellular signal‐regulated kinase; ND, normal diet; and n.s., not significant.
