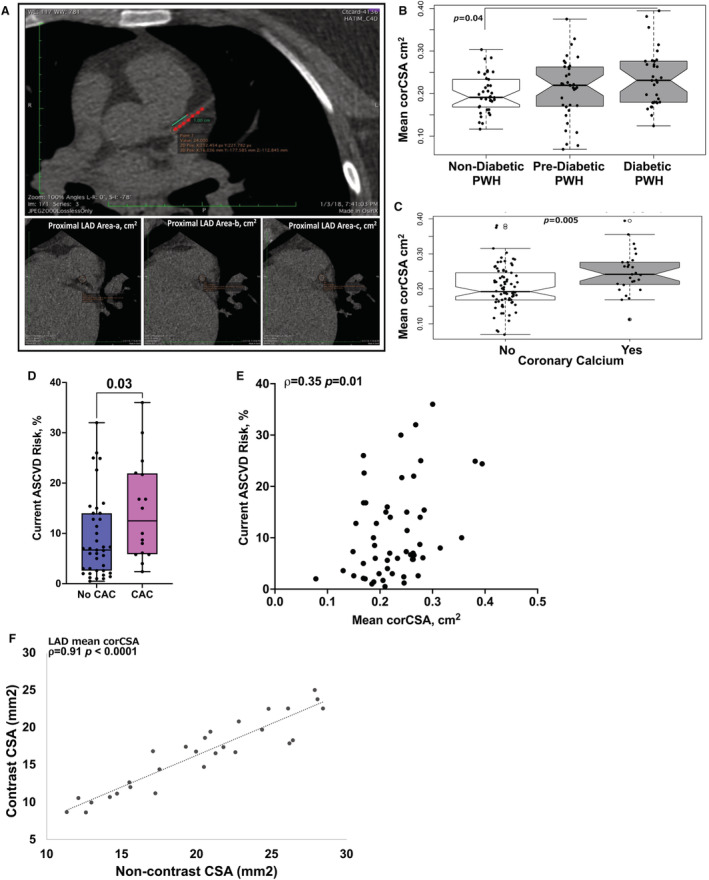
Figure 1. Mean corCSA is higher with coronary calcium and correlated with ASCVD risk.

Representative computed tomography image (CT) demonstrating the technique for measuring coronary cross‐sectional area (corCSA) of the proximal left anterior descending coronary artery (LAD) using previously published methods. The proximal 1.0 cm of the LAD was identified, at 3 equidistant points as labeled a, b, and c. The corCSA includes the area of the wall of the vessel as well as the lumen. Mean corCSA is the average of all 3 areas (A). Notched box plots showing mean corCSA by diabetes status (B) and by quantifiable calcium on CT imaging (C). Box plots showing current atherosclerotic cardiovascular disease (ASCVD) risk score in persons with HIV (PWH) with and without coronary artery calcium (CAC) (D) and correlation between ASCVD risk score and corCSA (E). Correlation plot of corCSA measurements obtained by noncontrast CT and coronary computed tomography angiography imaging (n=28). Analyses were performed using Kruskal–Wallis test (B), Mann–Whitney U tests (C and D), and Spearman rank correlation (E and F).
