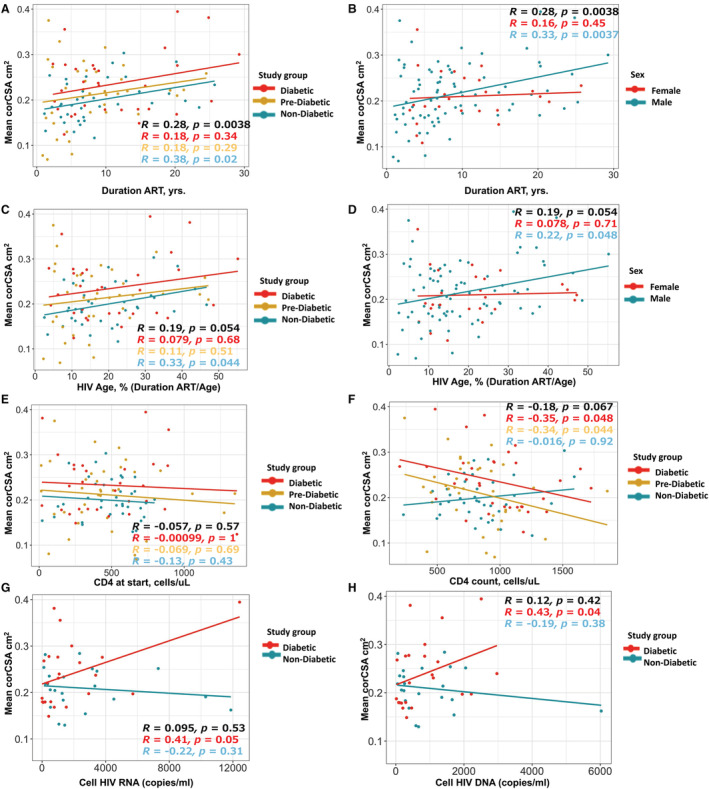
Figure 4. Mean coronary cross‐sectional area (corCSA) positively correlates with duration of antiretroviral therapy (ART), cell‐associated HIV RNA/DNA, and negatively with CD4 T cell count.

Unadjusted correlation plots of mean corCSA and duration of ART in all persons with HIV (PWH) by diabetes status (A) and sex (B). Similar correlation plot of mean corCSA and HIV age (a calculation of the duration of ART divided by age at study enrollment) stratified by metabolic status (C) and sex (D). Mean corCSA was also measured against CD4 T‐cell count at the start of therapy (E), CD4 at study enrollment (F), cell‐associated HIV RNA (G), and cell‐associated HIV DNA (H). Spearman rank test was used for statistical analysis. Note that the correlations are rank‐based whereas the slopes are based on the original data, and therefore, they may not always be in the same direction (eg, Spearman's correlation=−0.016 for those who were nondiabetic in (F), but slightly positive slope with Pearson's correlation=0.17, P=0.33).
