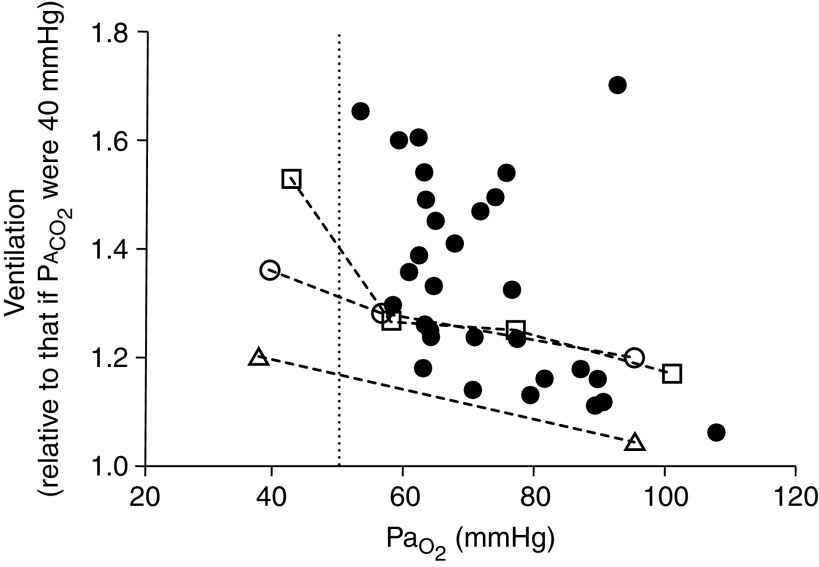
Figure 1.
PaO2 plotted against 40/alveolar partial pressure of CO2 (PaCO2), indicating alveolar ventilation (a) relative to that which would be present in the same patient had PaCO2 been normal at 40 mm Hg (n = 30; solid circles). In no patient was relative a less than 1.0 or less than that calculated for healthy young adult subjects from Wagner and colleagues (2) (open circles, dashed lines representing 7 males and 1 female; mean ± SD age, 29.8 ± 6.1 yr), Hammond and colleagues (3) (open triangles, dashed lines representing 10 males; mean ± SD age, 22.0 ± 1.2 yr), and Torre-Bueno and colleagues (4) (open squares, dashed lines representing 9 males; mean ± SD age, 26.0 ± 6.0 yr). PaCO2 for historical control subjects was calculated using measured PaCO2, and the multiple inert gas elimination technique was used to measure a/ inequality to estimate the arterial–alveolar difference. Vertical dotted line represents PaO2 = 50 mm Hg.

