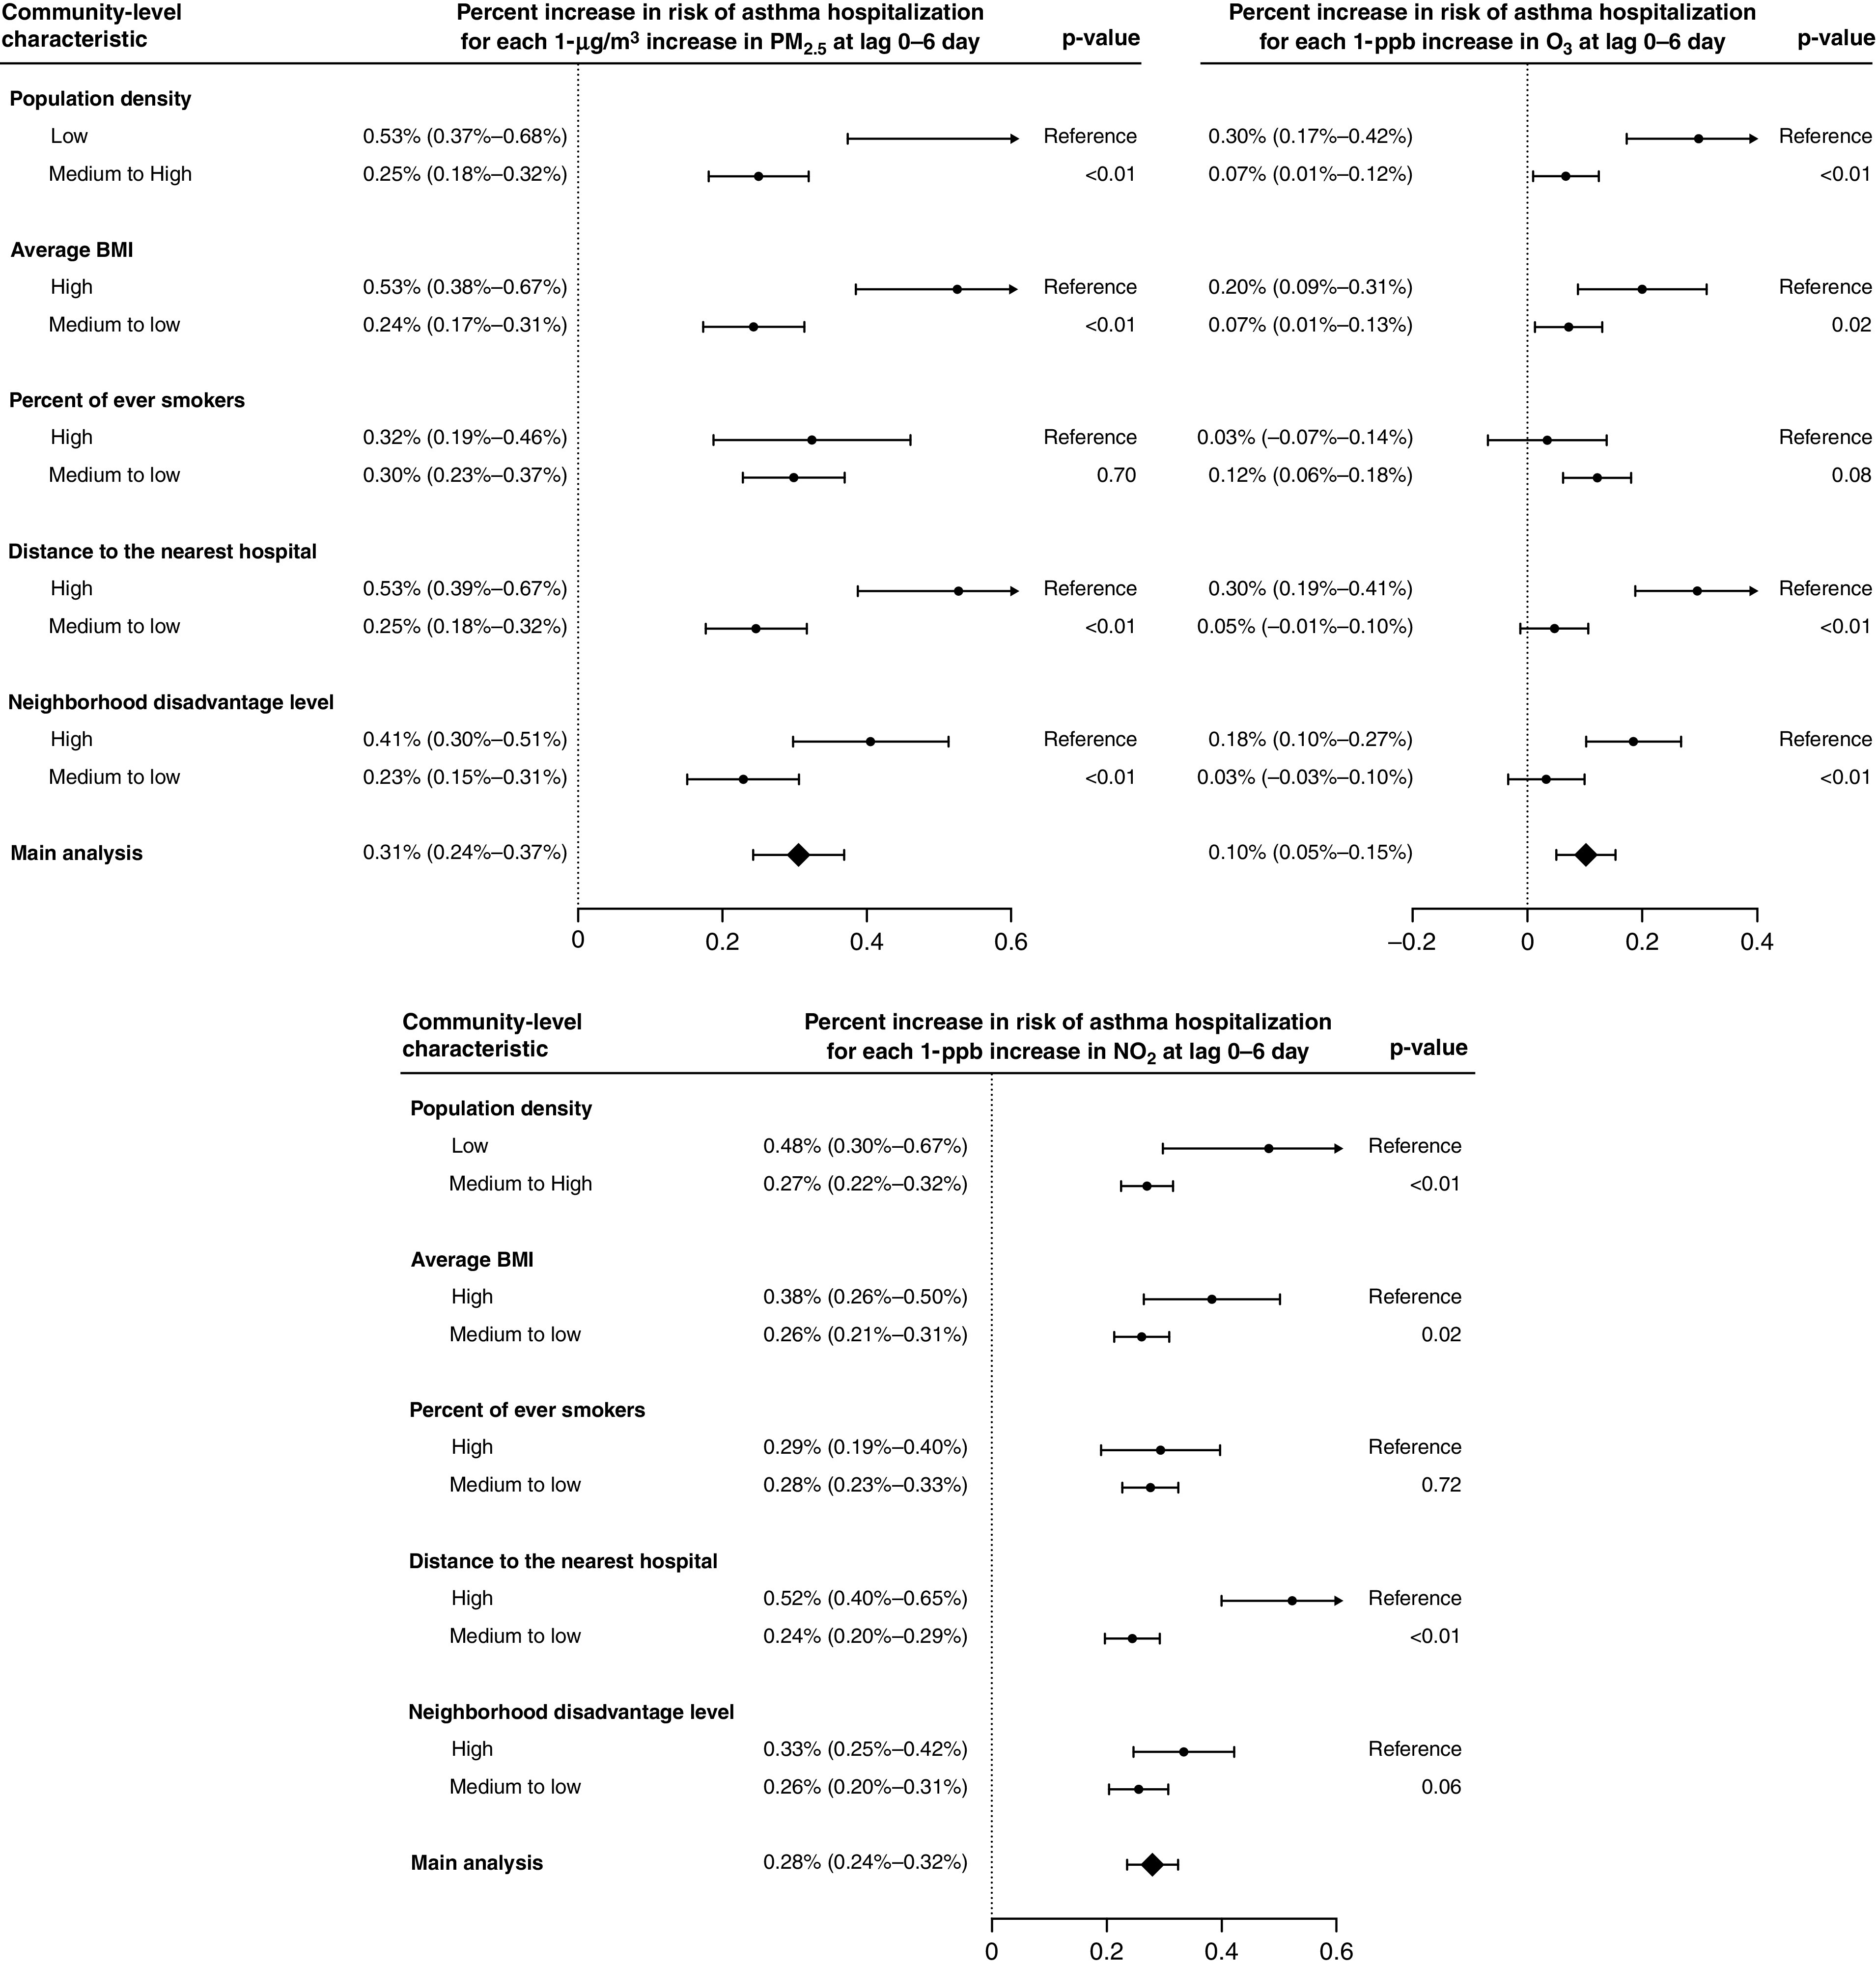
Figure 4.

Percent increases (and Bonferroni-corrected 95% confidence intervals) in risk of asthma hospitalization associated with 1-μg/m3 increase in PM2.5, 1-ppb increase in warm-season ozone (O3), and 1-ppb increase in nitrogen dioxide (NO2) at the moving average of lag 0–6 days for each subgroup of community-level characteristics. “Low” represents subgroups within the bottom 25% of the characteristics, and “High” represents subgroups within the top 25% of the characteristics. P values for the independent sample t tests were used to compare subgroup differences. Further separate analysis by age group was performed with results provided in Figure E6. BMI = body mass index; PM2.5 = particulate matter with an aerodynamic diameter of ⩽2.5 μm.
