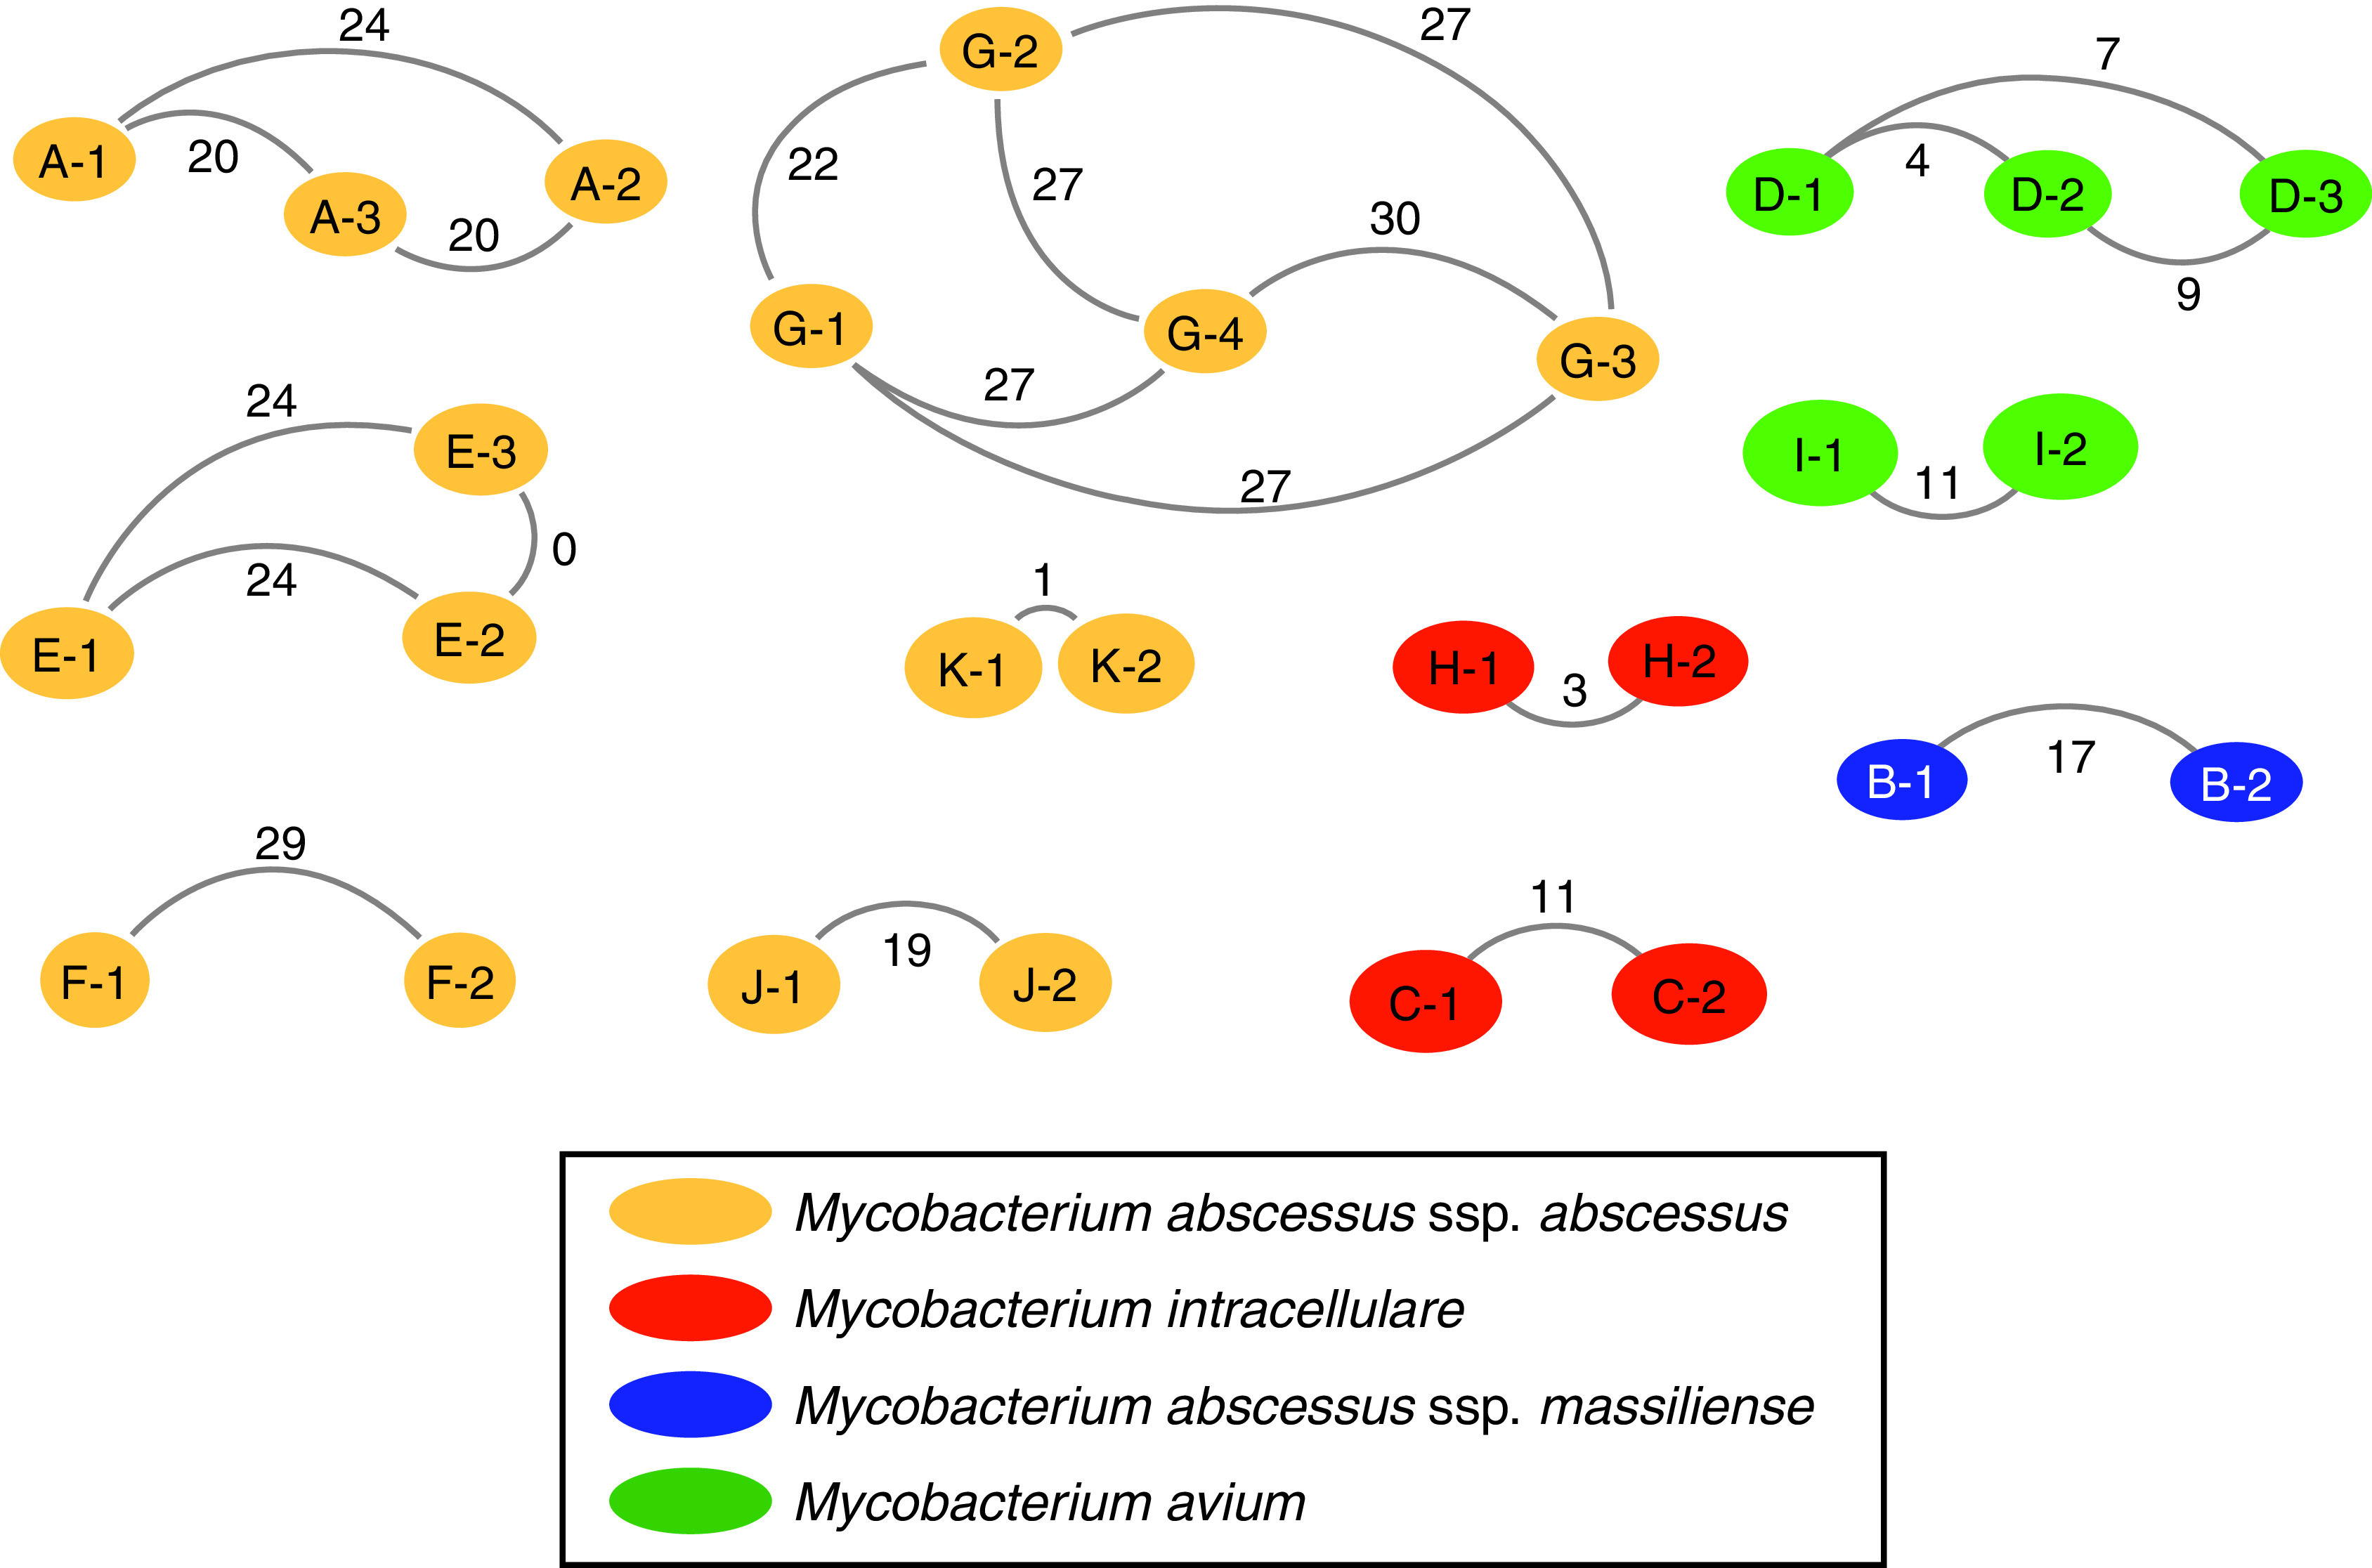
Figure 3.

Cluster network analysis. Nontuberculous mycobacteria species are identified by color, and the letter identifies the cluster: Mycobacterium abscessus subspecies (ssp.) abscessus shown in yellow, Mycobacterium intracellulare shown in orange, Mycobacterium abscessus ssp. massiliense shown in blue, and Mycobacterium avium shown in green. Nodes represent each subject within a cluster. The number in the node identifies the subject order based on first positive culture. Core genome SNP distance is shown with the line connecting nodes.
