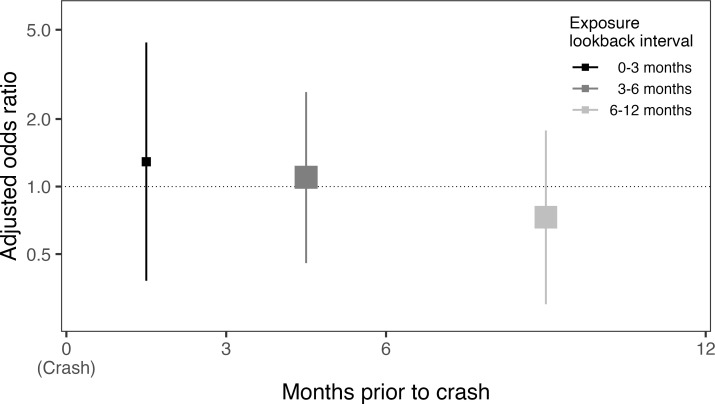
Fig 3. Forest plot of alternate exposure lookback intervals.
Forest plot of piecewise exposure lookback intervals (from left to right: 0–3 months; 3–6 months; 6–12 months). X-axis depicts the exposure lookback interval; Y-axis, the odds ratio for the association between syncope and crash responsibility; squares, the adjusted odds ratio point estimate (with size reflecting the inverse of the standard error); vertical lines, the 95% confidence interval.

