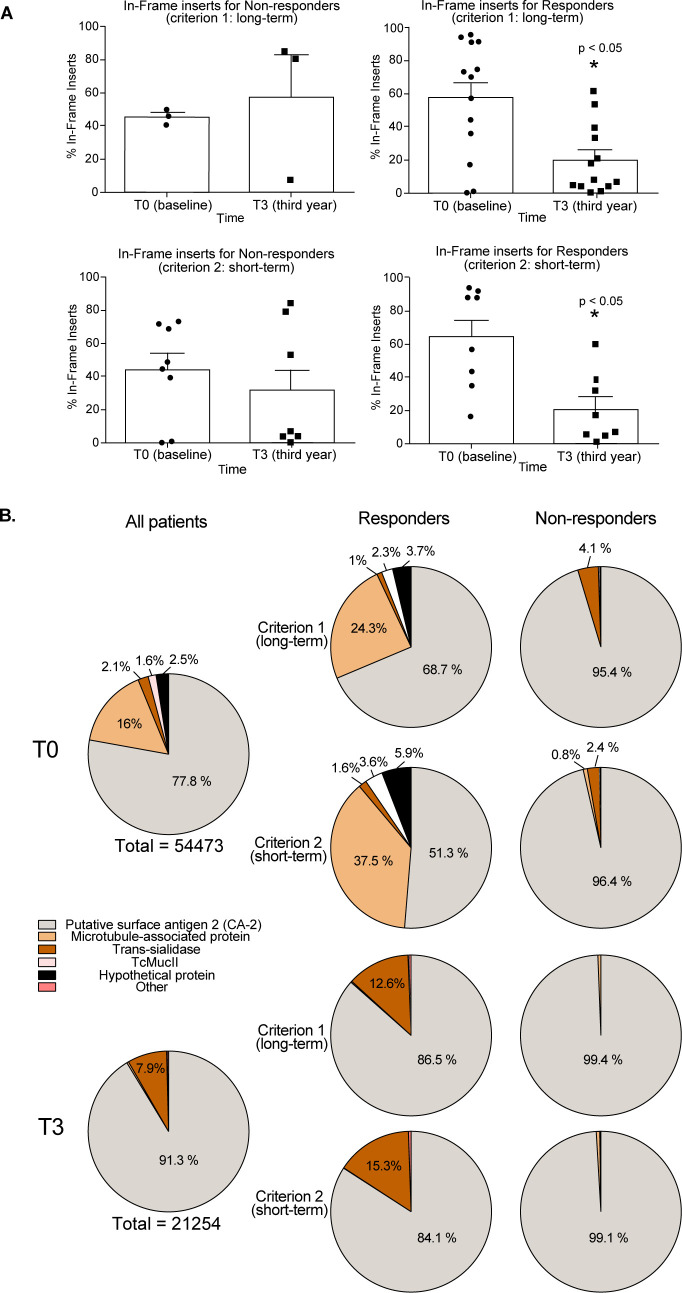
Fig 4. gPhage predicts treatment outcome.
(A) Bar graphs displaying the percentage of in-frame inserts for responders and non-responders according to both short- and long-term criteria. Responders showed a significant reduction in the percentage of in-frame inserts at T3 compared with T0 (Student T-test). (B) Pie graphs summarizing antigens recognized by responder and non-responder patients at T0 and T3 according to each criterion.

