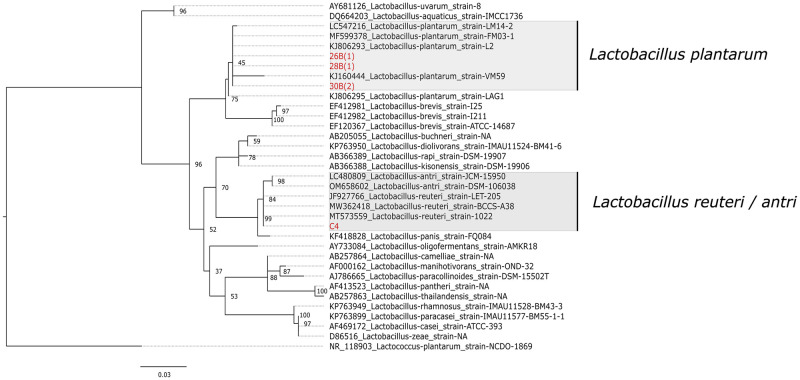
Fig 2. Maximum likelihood tree based on 16S rDNA gene sequences of different Lactobacillus spp.
The isolates of the study are indicated in red font. Lactococcus plantarum was chosen as an out-group. The scale bar (0.03) shows the nucleotide substitution rate per site. Bootstrap probabilities as determined for 1000 replicates are shown at nodes. The isolate C4/36(4) has been labeled as C4 in the given phylogenetic tree.

