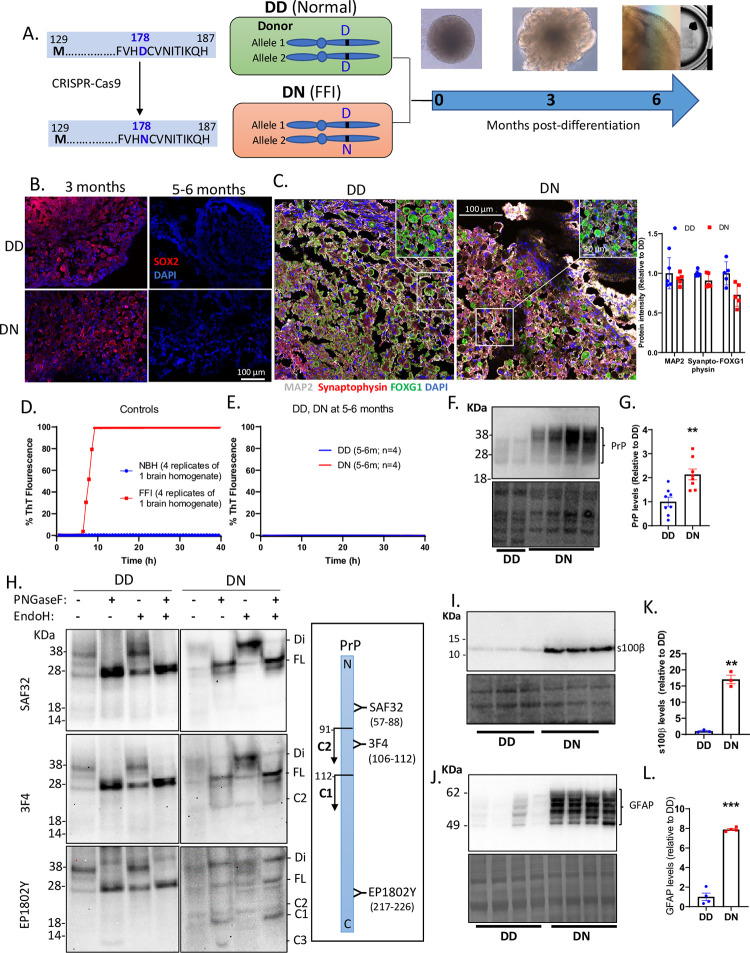
Fig 1. Generation of cerebral organoids and prion disease pathology.
(A) A schematic diagram of how the D178N mutation was introduced into the PRNP gene of iPSCs donated by a healthy donor with a 178D and 129M in both alleles of PRNP gene (DD) to produce a heterozygous mutant line (DN). The cerebral organoids were generated from the DD and DN iPSCs and we studied them when they matured at ~5–6 months old. (B) Immunofluorescence images of the organoids at ~3 and ~6 months old labeled with SOX2. (C) Immunofluorescence images of the organoids at ~5 months old labeled with neuronal markers synaptophysin and MAP2, and cortical marker FOXG1. Insets show magnified images. The right panel is the quantification of those markers. (D, E) RT-QuIC assessment of prion seeding activity in control homogenates from a terminally ill FFI brain and a healthy brain (D), and in lysates from DD and DN COs at ~5–6 months old (E). (F) Western blot showing PrP in lysates of DD and DN COs using 3F4 prion antibody (upper panel) and the Coomassie stain for total protein (lower panel). (G) Quantification of the PrP levels after normalizing to the total protein. (H) Western blot detection of PrP using SAF32, 3F4, and EP1802Y antibodies in DD and DN lysates before (-) and after treatment (+) with either/both PNGaseF and Endoglycosidase H. Acronyms listed on the right indicate PrP species/fragments, including those that are di-glycosylated (Di), Full length (FL), and cleavage C1/C2/C3 fragments. The right panel is a schematic diagram of PrP (N to C terminus) with the binding sites of the PrP antibodies used and the cleavage sites that yield the C1 and C2 fragments. (I) Western blotting for s100β (top left panel) and the Coomassie stain for total protein (bottom left panel). (J) Western blot detection of GFAP (top left panel) and the Coomassie stain for the total protein (bottom left panel). (K, L) Quantification of the s100β and GFAP levels after normalizing to the total protein. (F, H, I, J). For each blot molecular weight markers are on the left. (C, G, K, L) Each dot is an “n” representing an organoid. Data are presented as mean ±SEM. (G, K, L) Statistically compared by Welch’s t-test. ** p<0.01, ***p<0.001.

