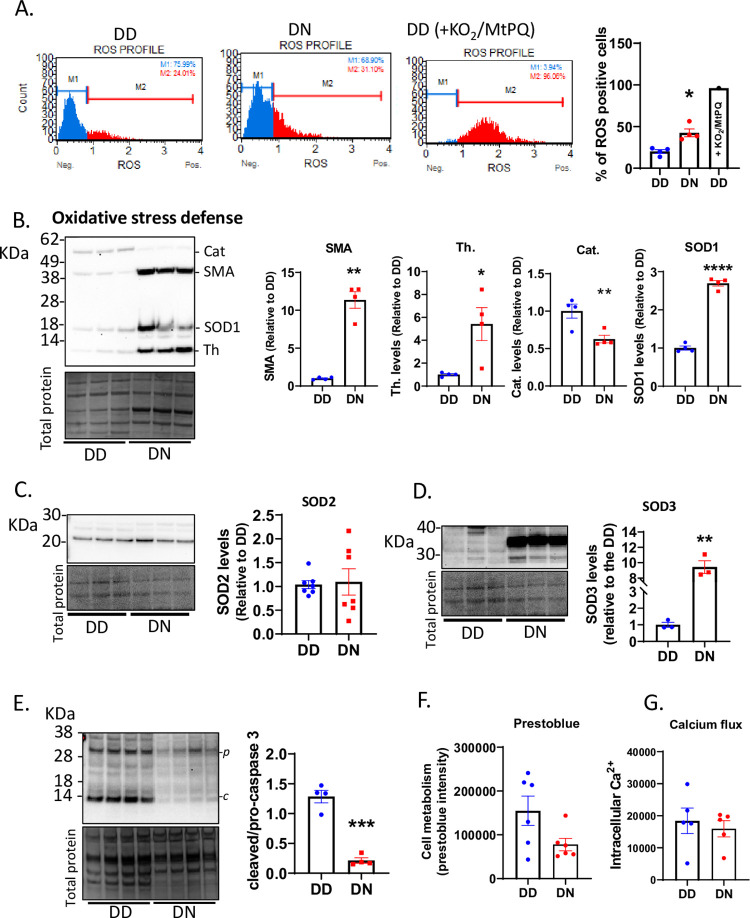
Fig 3. Oxidative stress is observed in the D178N COs.
(A) Flow cytometry analysis of the number of cells that were ROS positive in the DD and DN COs and in a DD organoid treated with 1mM KO2 and 12.5μM Mito-Paraquat (MtPQ) to increase ROS (positive control). The left panels are representative plots and the right graph is the quantification expressed as the percentage of cells that are ROS positive. (B) Western blotting (Top left panel) for antioxidant markers, including catalase (Cat), SOD1, and thioredoxin (Th.), and for smooth muscle actin (SMA). The Coomassie stain loading control is the bottom left panel. The quantifications after normalizing to total protein are in the right panels. (C) Western blotting for SOD2 (top left panel), the Coomassie stain for total protein (bottom left panel), and the quantification of the levels of SOD2 after correcting to the total protein (right panel). (D) Western blotting for SOD3 (top left panel), the Coomassie stain for total protein (bottom left panel), and the quantification of the levels of SOD3 after correcting to the total protein (right panel). (E) Western blotting for pro-caspase 3 (p) and cleaved caspase 3 (c; top left panel), the Coomassie stain for the total protein (bottom left panel), and the quantification of the levels of cleaved/pro-caspase 3 after correcting to the total protein (right panel). (F) Prestoblue analysis of cell metabolism in the organoids at ~6 months old. (G) Levels of intracellular calcium in the organoids at ~6 months old. (B, C, D, E) Molecular weight markers are shown on the left of blots. (A-G) The average protein levels of DN were compared to the DD by Welch’s t tests. Each dot represents an organoid (“n”). Data were from 5-6-month-old COs and are presented as mean ±SEM. * p<0.05, ** p<0.01, *** p<0.001, ****p<0.0001.

