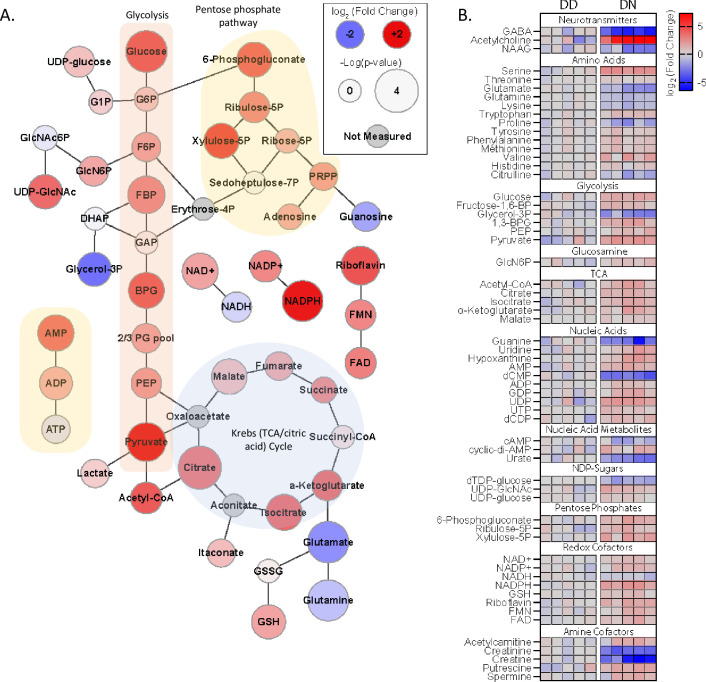
Fig 4. Altered metabolites are associated with the D178 mutation.
(A) Web diagram of the metabolites, indicating their roles in glycolysis, the pentose phosphate pathway and Krebs cycle, displaying relative changes in the DN compared with the DD (Log2 [fold change]; node color) and the -log(p-value) of the changes (node size). Raw data are in the S1 Dataset Metabolomics source data file (n = 5 organoids). (B) Heatmap showing the Log2 (fold change) in the levels of various metabolites in the DN relative to the DD COs, each column represents an individual organoid “n”. All data in this Figure were measured on 5-6-month-old COs using LCMS approaches.

