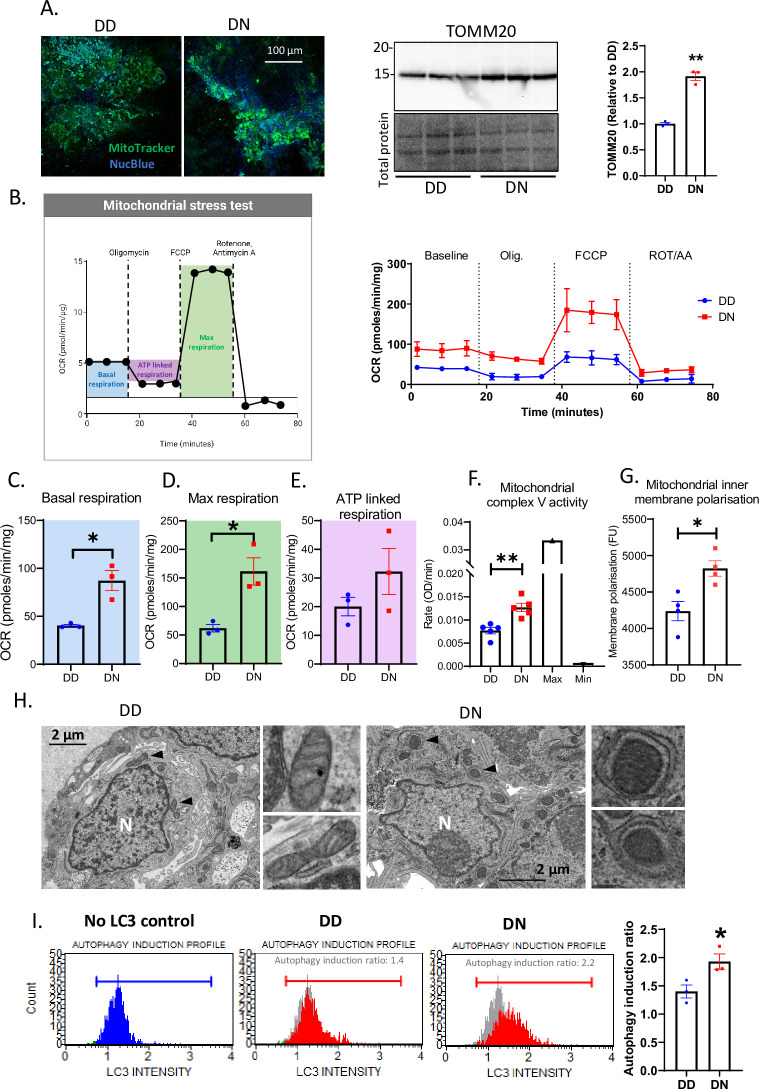
Fig 5. Abnormal mitochondrial activity is associated with increased autophagy/mitophagy in the DN COs.
(A) Immunofluorescence images of DD and DN COs labeled with MitoTracker and NucBlue (left panel) and a western blotting analysis of TOMM20 in DD and DN COs (right panel; total protein is the loading control; TOMM). (B-E) Seahorse analysis was used to assess mitochondrial stress by measuring the oxygen consumption rate (OCR) in DD and DN COs at the baseline level, and after sequential treatments with 1 μM Oligomycin, and 2 μM FCCP, 0.5 μM Rotenone/antimycin A, n = 3 (B). (B left panel) A schematic diagram (created with BioRender) displaying how parameters for mitochondrial stress test were extracted from the Seahorse raw data (B right panel). These parameters include the basal respiration (C; blue), maximal respiration (D; green), and ATP linked respiration (E; magenta). (F) Mitochondrial complex V (ATPase) activity measured in the DD and DN COs relative to the maximum activity in the positive control (bovine heart mitochondria) and the minimum activity in bovine heart mitochondria treated with 10 μM oligomycin. (G) The intensity of mitochondrial polarization in DD and DN COs. (H) TEM images of 4-week-old DD and DN organoids with the insets (right panels) showing higher magnification images of mitochondria indicated by the arrowheads. (I) Flow cytometry analysis of autophagy induction in DD and DN COs by detecting cells containing immuno-labeled LC3, with the left panels showing representative profiles (Blue profile shows the no autophagy induction control and this is indicated in grey behind the DD and DN autophagy profiles in red) and the right panel shows autophagy induction ratio. (C-G, I) The average readout in the DN was compared to the DD by Welch’s t test. Each dot is an “n” representing an organoid. Data, unless otherwise stated, were from 5-6-month-old COs and are presented as mean ±SEM. * p<0.05, ** p<0.01.

