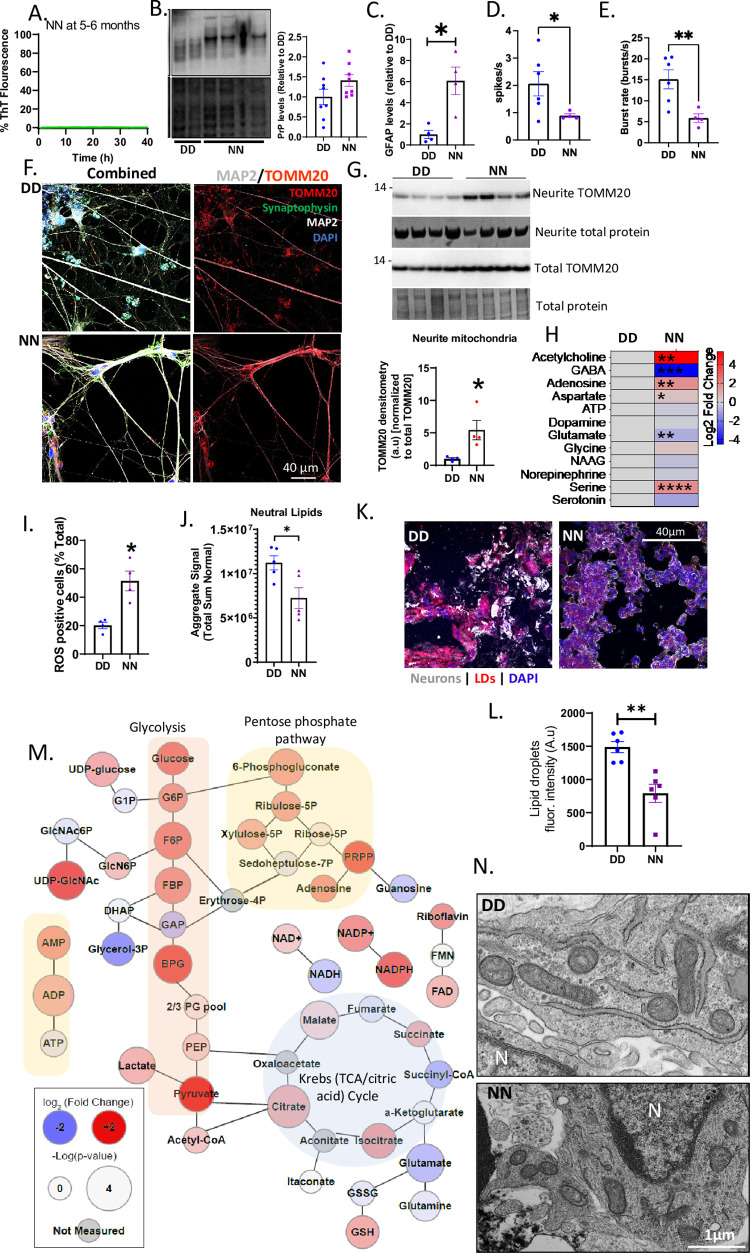
Fig 7. Abnormal phenotypes are dependent on the N178 allele.
(A) RT-QUIC analysis of COs with two N178 alleles (NN). (B) A representative western blot for PrP (by 3F4; top panel) with the Coomassie stain for the total protein (bottom panel) and the quantification of PrP relative to the total protein (right panel) (C) Levels of GFAP as detected by western blotting (blot shown in S6A Fig). (D, E) Spike or neuronal firing rate (D) and burst rate (E) of DD versus NN COs. Raw traces of neural oscillations and additional data are in S6B Fig. (F) Representative immunofluorescence images of DD (top panels) and NN (bottom panels) monolayer neurons labeled with TOMM20, synaptophysin, MAP2, and DAPI. The left panels show images with all the stains and the right panels show TOMM20 and MAP2. (G) Western blotting analysis of the neurite TOMM20 levels relative to the total TOMM20 after normalizing to total protein stained by Coomassie, blots are shown above with quantification below. (H) Log2 fold changes in the levels of NN neurotransmitters relative to the DD with the degrees of statistical significance determined by a Multiple Student’s t test, n = 5. Raw data are in the S1 Dataset Metabolomics source data file. (I) ROS levels in the DD and NN COs measured by flow cytometry. Representative plots are in S6E Fig. (J) The total levels of neutral lipids in the DD versus NN. Additional lipid data are shown in S6F Fig. (K) Representative fluorescence images of DD (left) and NN (right) COs labeled with MAP2 (for neurons), Nile Red stain (for lipid droplets, LDs), and DAPI. (L) Quantification of LDs. (M) Web diagram of the metabolites displaying relative changes in the NN COs compared with the DD (Log2 fold change; node color) and the -log(p-value) of the changes (node size), n = 5. Raw data are in the S1 Dataset Metabolomics source data file. (N) TEM images of mitochondria in DD and NN COs. (C-E, G, I, J, L) Mean readouts were compared between DD and NN by Welch’s t test. Each dot is an “n” representing an organoid. Data were from 5-6-month-old COs and are presented as ±SEM. * p<0.05, ** p<0.01, *** p<0.001, ****p<0.0001.

