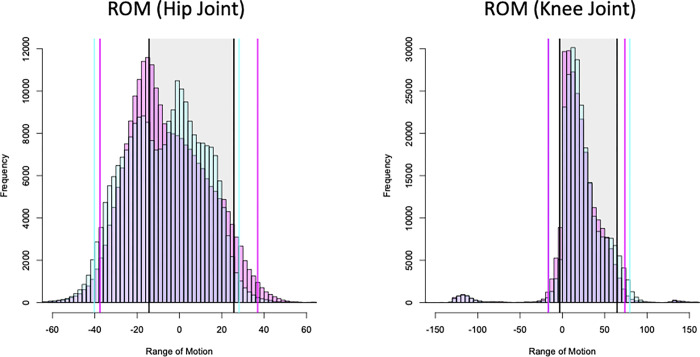
Fig 2. Histograms of ROM of hip and knee joints (left direction: red, right direction: blue).
The ranges in red and blue shading are 95% confidence intervals. The black shaded area indicates the maximum and minimum ROM during gait using inertial sensors as reported by Park et al. ROM, range of motion [20].

