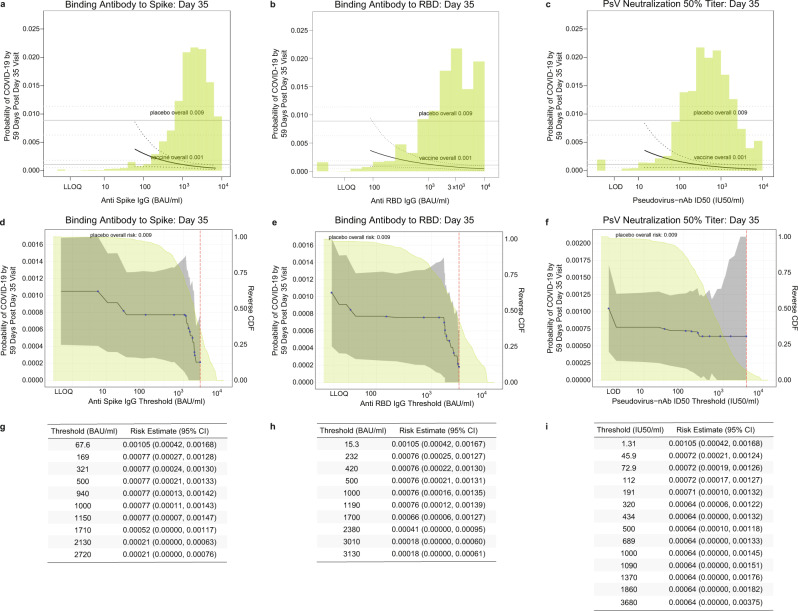
Fig. 4. Analyses of D35 antibody markers as a correlate of risk in baseline SARS-CoV-2 negative per-protocol vaccine recipients (U.S. study sites).
Baseline risk score-adjusted cumulative incidence of COVID-19 by 59 days post D35 by D35 a anti-spike IgG, b anti-RBD IgG, or c pseudovirus (PsV)-nAb ID50 titer, estimated using a marginalized Cox model. The dotted black lines indicate bootstrap pointwise 95% CIs. The upper and lower horizontal gray lines are the overall cumulative incidence of COVID-19 from 7 to 59 days post D35 in placebo and vaccine recipients, respectively. Curves are plotted over the antibody marker range from the 2.5th percentile to the 97.5th percentile: 60.9 to 6934 BAU/ml for spike IgG (where 6934 is the ULOQ), 89.8 to 9801 BAU/ml for RBD IgG (where 9801 is the ULOQ), and 14.2 to 7230 IU50/ml for PsV-nAb ID50. Baseline risk score-adjusted cumulative incidence of COVID-19 by 59 days post D35 by D35 d, g anti-spike IgG, e, h anti-RBD IgG, or f, i PsV-nAb ID50 titer above a threshold. The blue dots are point estimates at each COVID-19 primary endpoint linearly interpolated by solid black lines; the gray shaded area is pointwise 95% confidence intervals (CIs). The estimates and CIs assume a non-increasing threshold-response function. The upper boundary of the green-shaded area is the estimate of the reverse cumulative distribution function (CDF) of D35 antibody marker level. The vertical red dashed line is the D35 antibody marker threshold above which no COVID-19 endpoints occurred (in the time frame of 7 days post D35 through to the data cut-off date April 19, 2021). g–i D35 antibody marker thresholds, risk estimates, and 95% confidence intervals correspond to the plots in d–f. Source data are provided in Fig. 4 Source Data file. BAU, binding antibody unit; D35, Day 35 visit; ID50, 50% inhibitory dilution; nAb neutralizing antibody; RBD receptor binding domain; ULoQ, upper limit of quantification.

