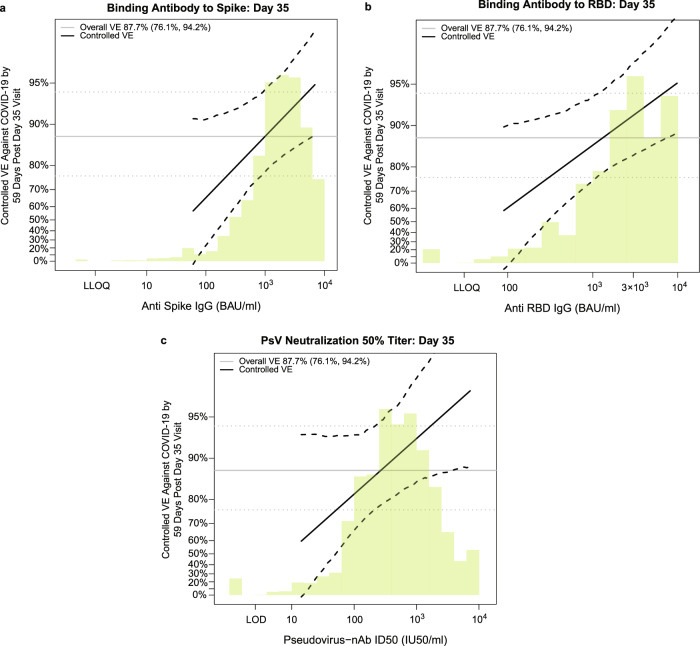
Fig. 5. Vaccine efficacy by D35 antibody marker level in baseline SARS-CoV-2 negative per-protocol vaccine recipients (U.S. study sites).
Curves shown are for D35 a anti-spike IgG concentration, b anti-RBD concentration, or c pseudovirus (PsV)-nAb ID50 titer. The dotted black lines indicate bootstrap pointwise 95% confidence intervals. The green histogram is an estimate of the density of D35 antibody marker level, and the horizontal gray line is the overall vaccine efficacy from 7 to 59 days post D35, with the dotted gray lines indicating the 95% confidence intervals. Analyses adjusted for baseline risk score. Curves are plotted over the antibody marker range from the 2.5th percentile to the 97.5th percentile: 60.9–6934 BAU/ml for anti-spike IgG (where 6934 is the ULOQ), 89.8–9801 BAU/ml for anti-RBD IgG (where 9801 is the ULOQ), and 14.2–7230 IU50/ml for PsV-nAb ID50. Source data are provided in Fig. 5 Source Data file. BAU binding antibody unit; D35, Day 35 visit; ID50, 50% inhibitory dilution; nAb neutralizing antibody; RBD receptor binding domain; ULoQ upper limit of quantification.

