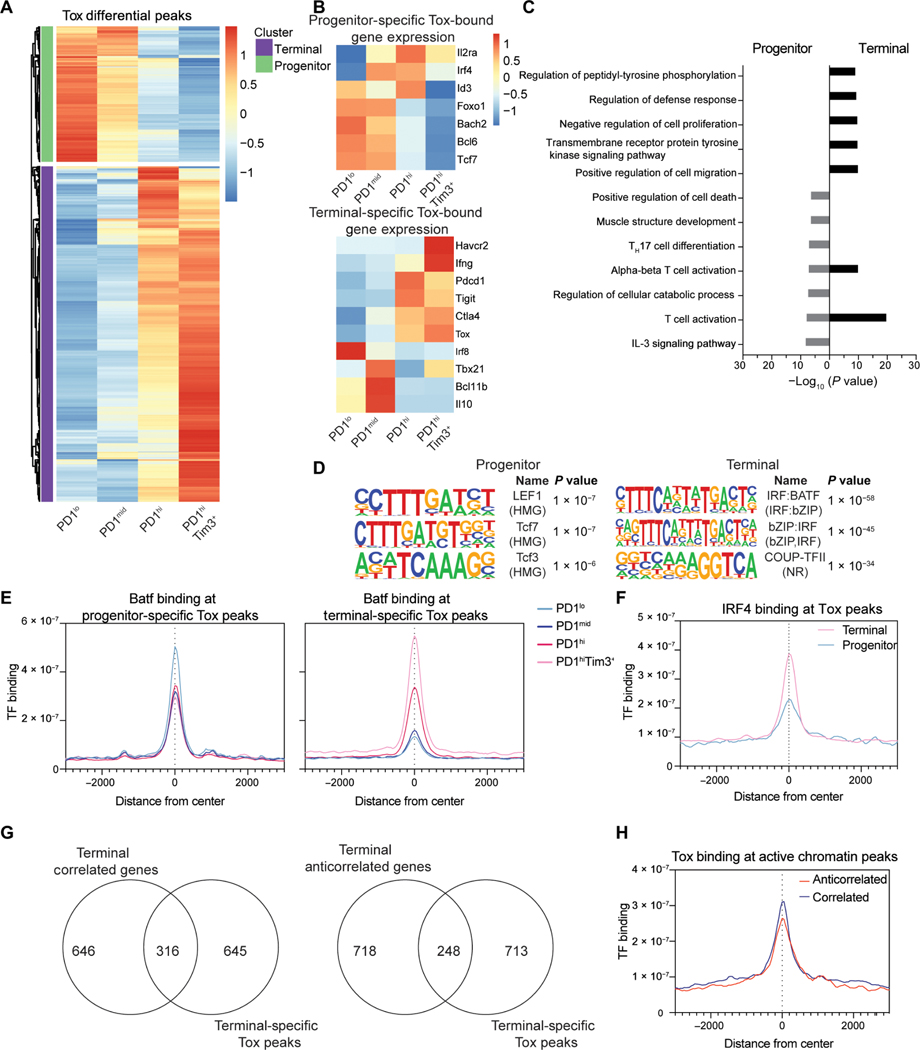
Fig. 4. Tox associates with state-specific transcription factors TCF1 and Batf/IRF4.
(A) Normalized CPM of Tox at differential peaks identified between TIL subsets (DESeq2). (B) Normalized TPM at selected genes associated with progenitor-specific and terminal-specific Tox peaks. (C) −Log10 (P value) values for GO term pathways identified by Metascape enriched for genes with progenitor and terminally exhausted–specific Tox binding. (D) Top results from HOMER motif analysis of DESeq2-defined Tox differential peaks in progenitor or terminally exhausted T cells. Terminally exhausted–specific peaks used as background for progenitor exhausted–specific analysis and vice versa. (E) Batf coverage at progenitor and terminal-specific DESeq2-defined differential Tox peaks. n = 1. (F) IRF4 binding (GSE54191) at progenitor and terminal-specific DESeq2-defined differential Tox peaks. IRF4 ChIP-seq is in vitro–activated T cells (61). (G) Terminal specific peaks of active chromatin (H3K4me3, H3K27Ac, and H3K9Ac) grouped by those with correlated or anticorrelated gene expression associated with terminal-specific Tox peaks. (H) Tox coverage in terminally exhausted cells at active chromatin defined as having anticorrelated and correlated gene expression as in Fig. 2. CUT&RUN for Tox (n = 2) and Batf (n = 1) was performed with 8 to 10 mice pooled per experiment before sorting.

