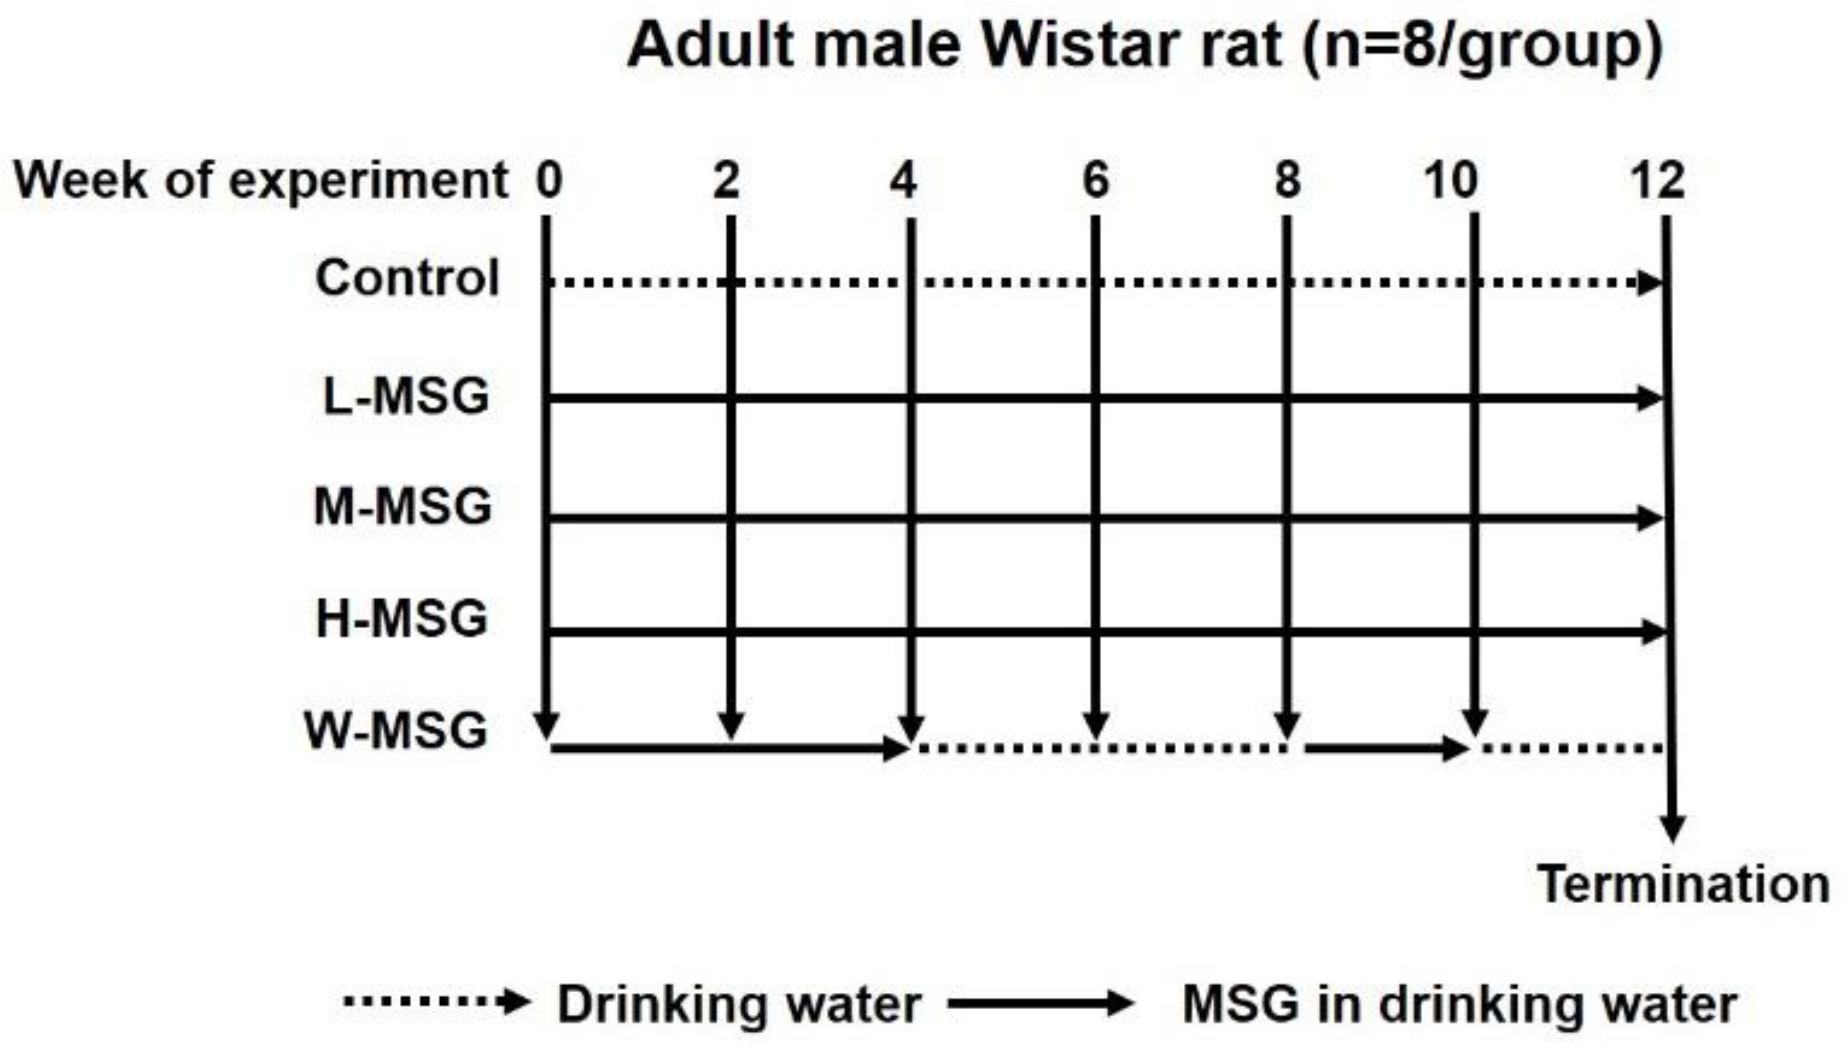
Figure 1. Experimental design.

Adult male Wistar rats were divided into five groups (n=8 in each); 1) control group fed a standard diet and normal drinking water; 2) low MSG consumption group (L-MSG) fed a standard diet and 0.5 g% MSG in drinking water; 3) medium MSG consumption group (M-MSG) fed a standard diet and 1.5 g% MSG in drinking water; 4) high MSG consumption group (H-MSG) fed a standard diet and 3.0 g% MSG in drinking water; 5) MSG-withdrawal group (W-MSG) fed a standard diet with and without 3.0 g% MSG in drinking water for 4 and 2 consecutive weeks.
