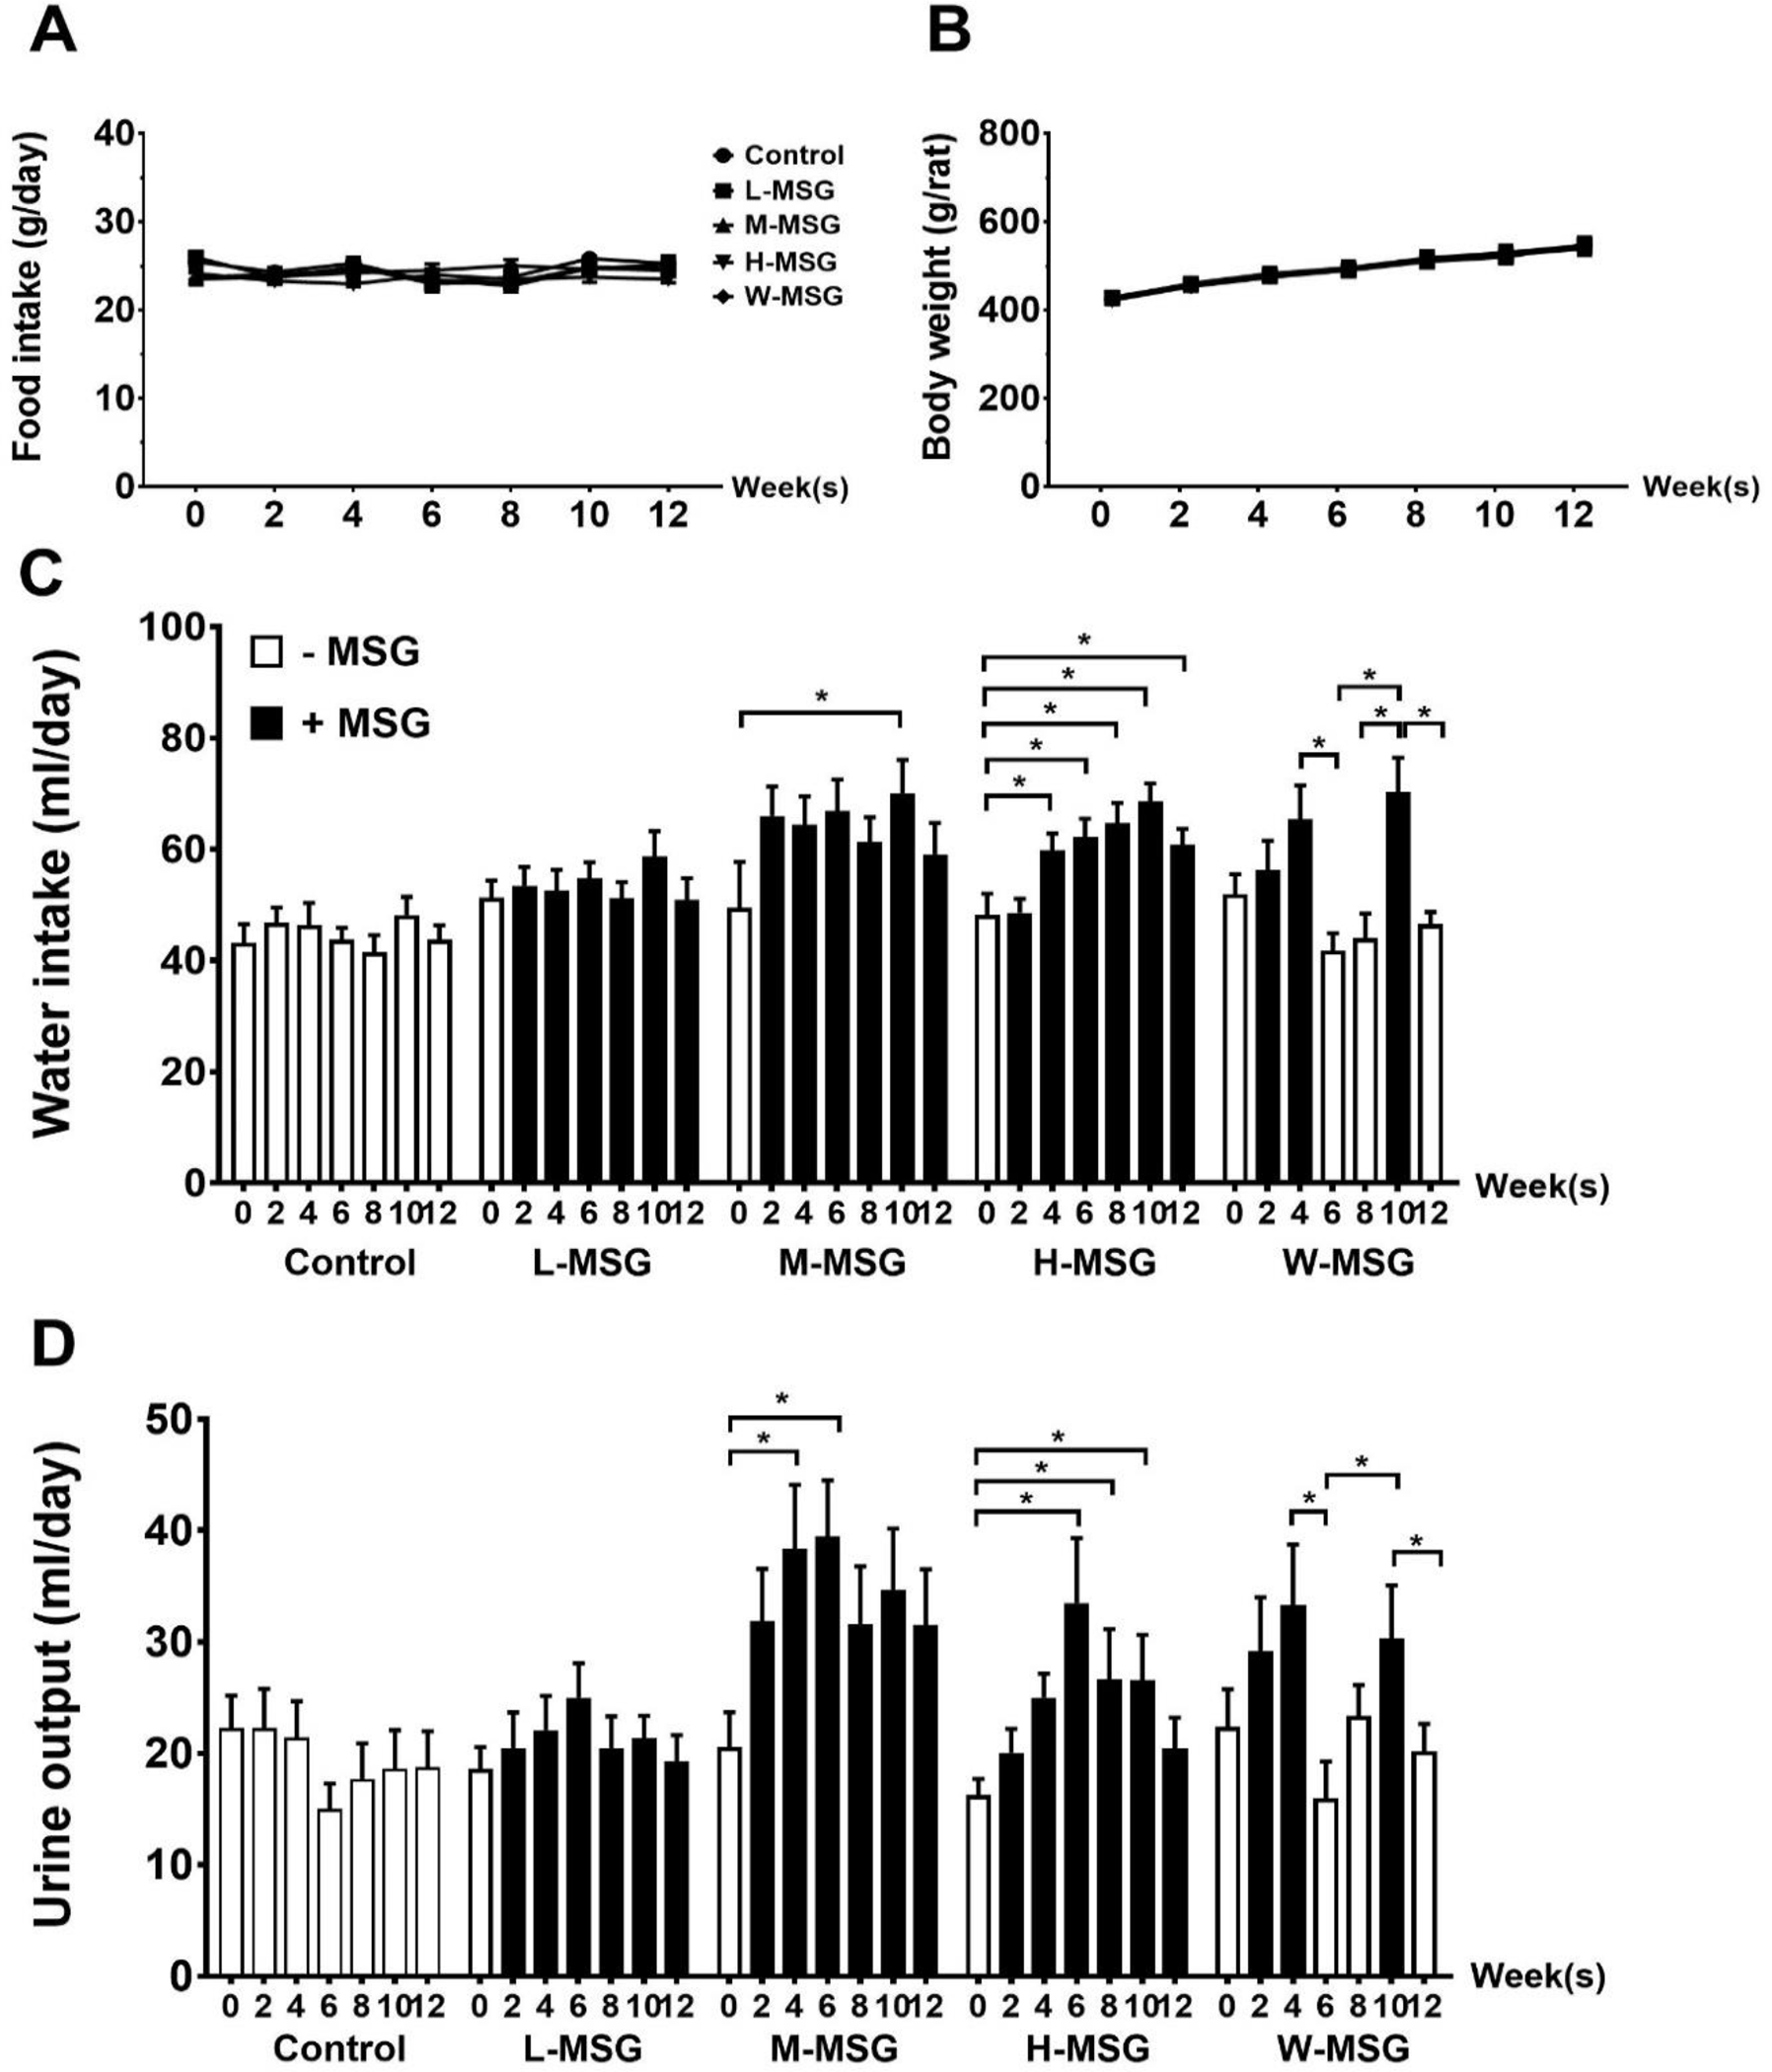
Figure 2.

Effects of MSG consumption on food intake (A), body weight (B), water intake (C), urine output (D) of rats at various time-points during 12 weeks of the experiment. Data are shown as mean ± SEM and p-values were calculated by one-way ANOVA with post-hoc LSD tests (*p < 0.05). Control group (n=7), L-MSG group (n=8), M-MSG group (n=8), H-MSG group (n=8), W-MSG group (n=8).
