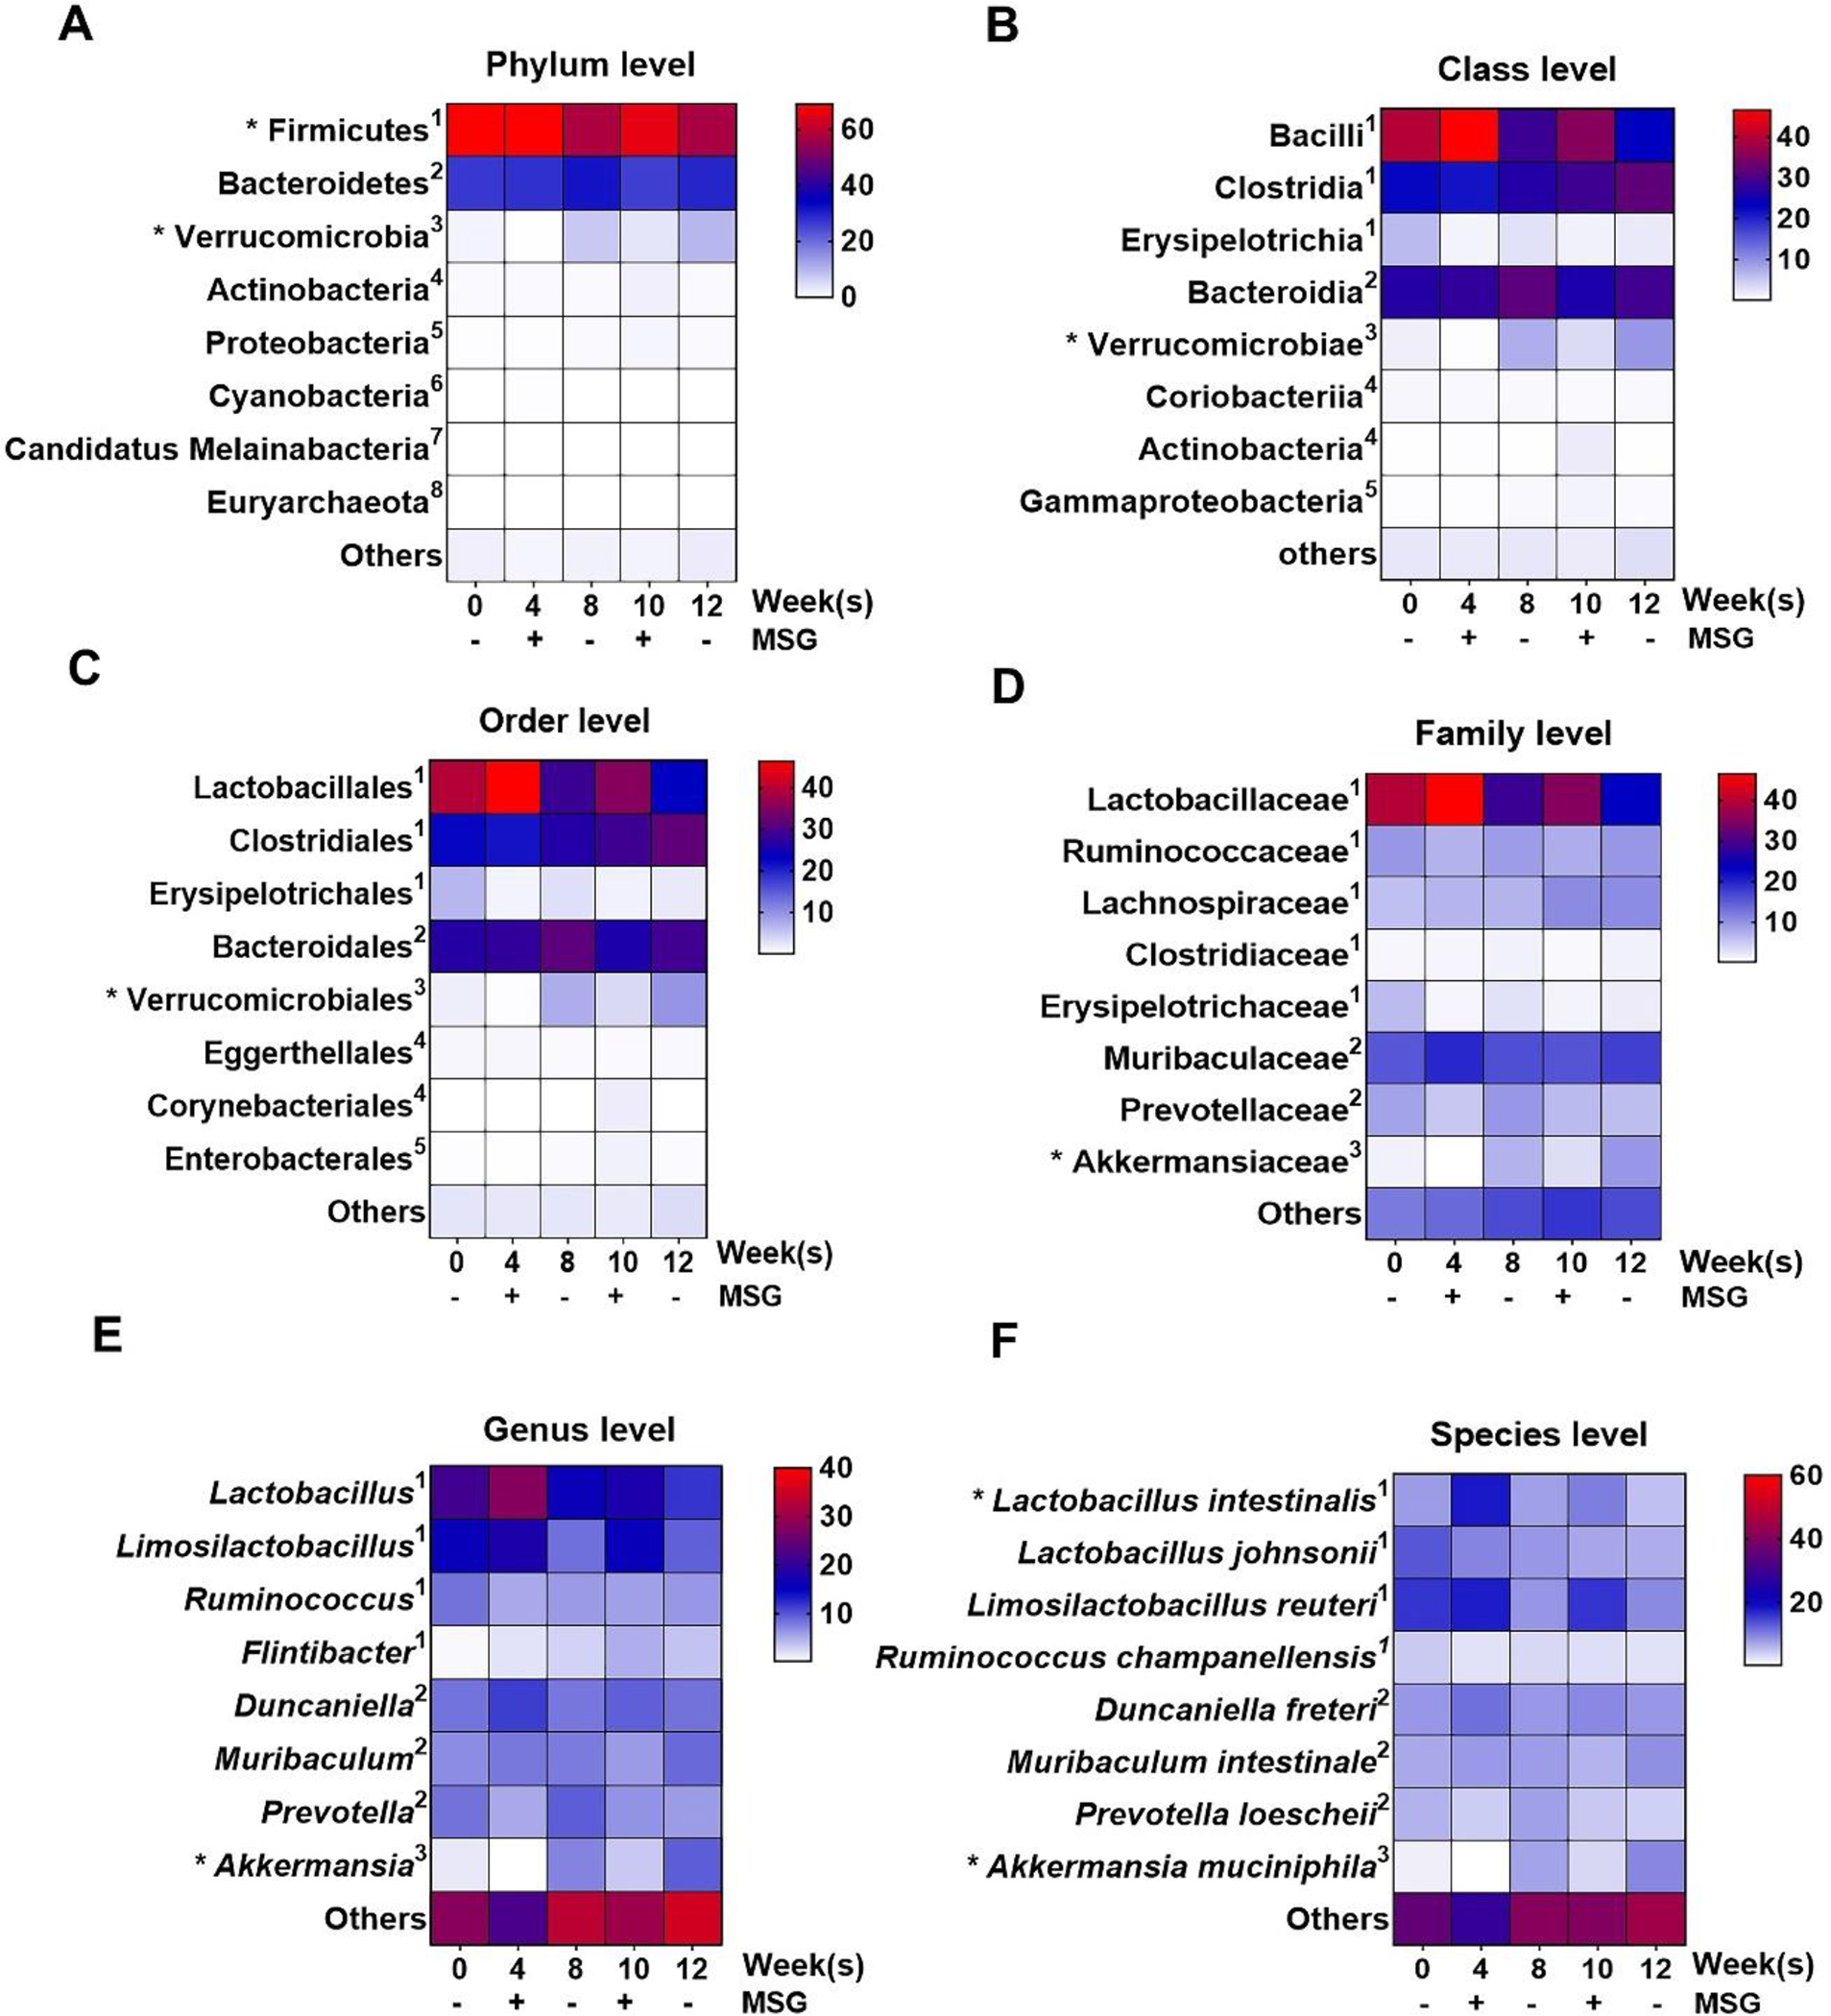
Figure 7.

The relative operational taxonomic unit (OTU) abundance at various levels in fecal samples of MSG-withdrawal group (n=6) is shown by heatmap. The color key corresponds to the percent relative abundance in the gut microbiota at each expression level and * shows significant change. 1,2,3,4,5,6,7,8 represents the corresponding phylum.
