. 2023 Jan 19;12:e82843. doi: 10.7554/eLife.82843

Figure 2. Hypoxia transcriptionally and post-translationally reduces full-length SM levels.

(A) HEK293T cells were incubated under normoxic or hypoxic conditions for 24 hr. Levels of the indicated transcripts were quantified, normalized to the levels of RPL11, GAPDH and ACTB housekeeping transcripts and adjusted relative to the normoxic condition, which was set to 1 (dotted line). (B) HEK293T cells were transfected with (HA)3-SM-V5 for 24 hr and incubated under normoxic or hypoxic conditions for the indicated times. (C) HEK SM-N100-GFP-V5 cells were treated with or without 20 µM MG132 and 20 nM bafilomycin A1 under normoxic or hypoxic conditions for 16 hr. (D) HEK293T cells were transfected with the indicated constructs for 24 hr and incubated under normoxic or hypoxic conditions for 16 hr. (B–D) Graphs depict densitometric quantification of protein levels normalized to the respective normoxic conditions for each timepoint, treatment or construct, which were set to 1 (dotted line). (A–D) Data presented as mean ± SEM from n=3–6 independent experiments (*, p≤0.05; **, p≤0.01; [A, B] two-tailed one-sample t-test vs. hypothetical mean of 1; [C, D] two-tailed ratio paired t-test).

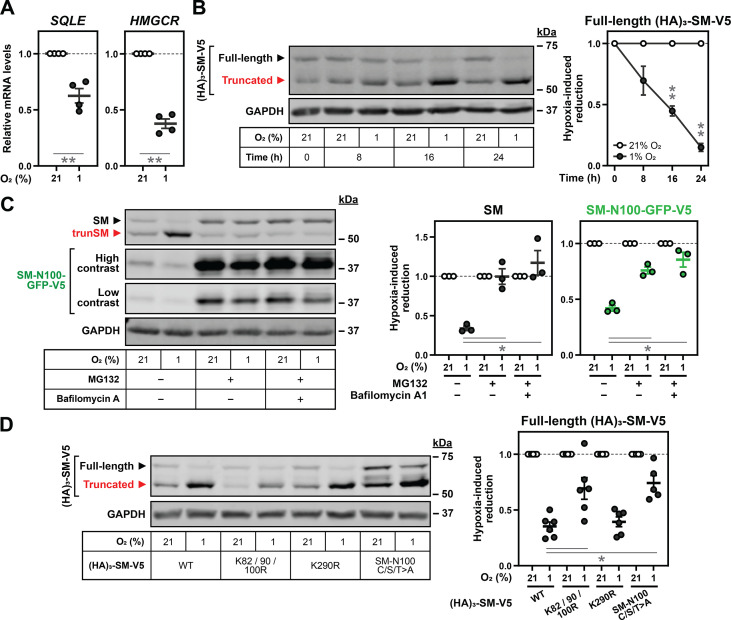
Figure 2—source data 1. Uncropped immunoblots for Figure 2.

Figure 2.

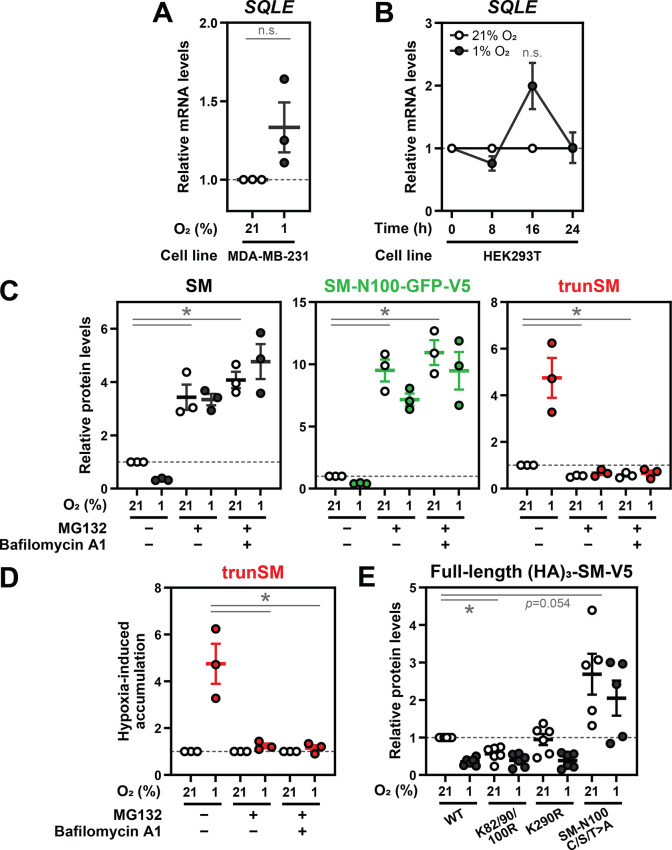
Figure 2—figure supplement 1. Hypoxia-induced degradation of full-length SM is via the ubiquitin-proteasome system.

Figure 2—figure supplement 1.

(A) MDA-MB-231 cells were incubated under normoxic or hypoxic conditions for 24 hr. (B) HEK293T cells were treated as described in Figure 2B. (A, B) Levels of SQLE transcripts were quantified, normalized to the levels of RPL11, GAPDH and ACTB housekeeping transcripts and adjusted relative to the normoxic condition, which was set to 1 (dotted line). (C) Quantification of SM, SM-N100-GFP-V5 and trunSM levels in Figure 2C normalized to the normoxic vehicle condition, which was set to 1 (dotted line). (D) Quantification of trunSM levels in Figure 2C normalized to the respective normoxic conditions for each treatment, which were set to 1 (dotted line). (E) Quantification of full-length (HA)3-SM-V5 SM levels in Figure 2D normalized to the normoxic wild-type condition, which was set to 1 (dotted line). (A–E) Data presented as mean ± SEM from n=3–6 independent experiments (*, p≤0.05; [A–C, E] two-tailed one-sample t-test vs. hypothetical mean of 1; [D] two-tailed ratio paired t-test).