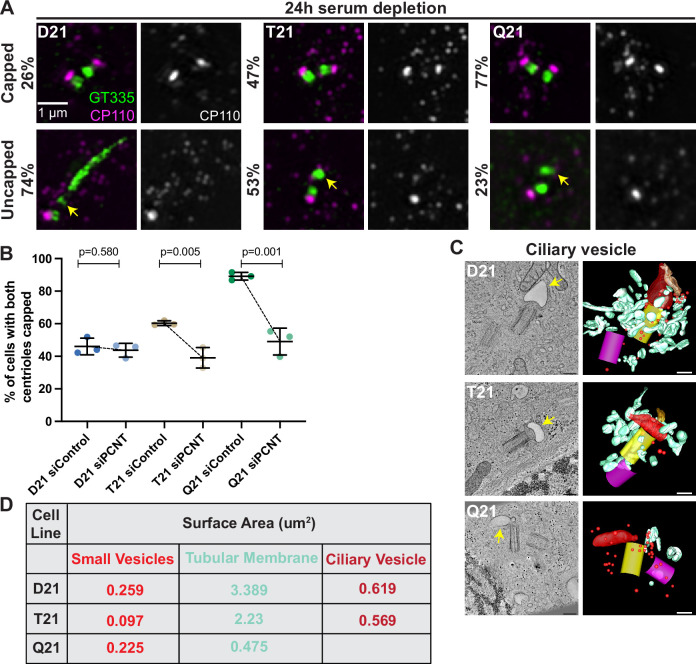
Figure 4. Increased HSA21 ploidy disrupts mother centriole uncapping in a PCNT-dosage-dependent manner.
(A) Representative structured illumination microscopy images of RPE1 D21, T21, and Q21 cells grown on coverslips and serum depleted for 24 hr. Cells were stained with GT335 and the centriole capping protein CP110. Percentages represent cells with indicated phenotype across 3 N’s. (B) Quantitation of CP110 centriole capping for control and siPCNT treated D21, T21, and Q21 cells. Graph show mean ± SD. N=3. Two-tailed unpaired t-test. (C) Selected tomographic slices and 3D models showing ciliary vesicle formation in D21, T21, and Q21 cells. T21 and Q21 have smaller ciliary vesicles (arrows) and the ciliary vesicle in Q21 cell is offset from the center of the mother centriole. Models show mother centriole (yellow), daughter centriole (magenta) ciliary vesicle (large red structure at the distal end of the mother centriole), smaller vesicles (red spheres), and smooth tubular membranes (blue-green). (D) Quantitation of membrane surface area at the centrosome in electron tomograms for D21, T21, and Q21 cells. D21 cells showed increased small vesicles (red spheres), smooth membranes (blue-green), and ciliary vesicle membrane (red structures) compared to T21 and Q21 cells. Ciliary vesicles in Q21 cells were not quantified due to low frequency (n of 1) and unusual offset of that ciliary vesicle. N=2 reconstructed cells per cell line. Scale bars are 200 nm. Movies of the complete volume and rotating models can be found in Figure 4—videos 1–3.


