. 2023 Jan 19;12:e78202. doi: 10.7554/eLife.78202

Figure 7. Elevated PCNT in a DS mouse model results in decreased primary cilia and cerebellar dysmorphology.

(A–C) Representative tiled confocal images of the cerebellum from P4 wild-type (WT) and Dp10 (A), Dp16 (B), and Dp17 (C) animals. Brain sections were stained with Hoechst 33342, ARL13B, and γ-tubulin. Insets show progressively zoomed in regions corresponding to the same folia in each animal. (D) Quantitation of primary cilia frequency in WT and Dp animals normalized to WT. Graph shows mean ± SD. N=3. Paired t-test. (E) Representative tiled confocal images of WT and Dp10 P4 animals corresponding to the same cerebellar folia in each animal. Brain sections were stained with Hoechst 33342 and a Pan-neuronal marker. Yellow bracket denotes external granular layer. (F) Quantitation of the external granular layer width in WT and Dp10 animals. Graph shows mean ± SD. N=3. Two-tailed unpaired t-test. (G) Quantitation of PCNT intensity in WT and Dp10 cerebellar slice cultures treated with control or PCNT siRNA. Values were normalized to WT siControl averages. Graph shows mean ± SD. N=3. Mann-Whitney U test. (H) Representative confocal images of WT and Dp10 cerebellar slice cultures isolated from P4 pups and treated with control or PCNT siRNA for 48 h in serum free media. Slices were stained with Hoechst 33342, ARL13B, PCNT. (I) Quantitation of primary cilia frequency in WT and Dp10 cerebellar slice cultures treated with control or PCNT siRNA. Graph shows mean ± SD. N=3. Mann-Whitney U test.

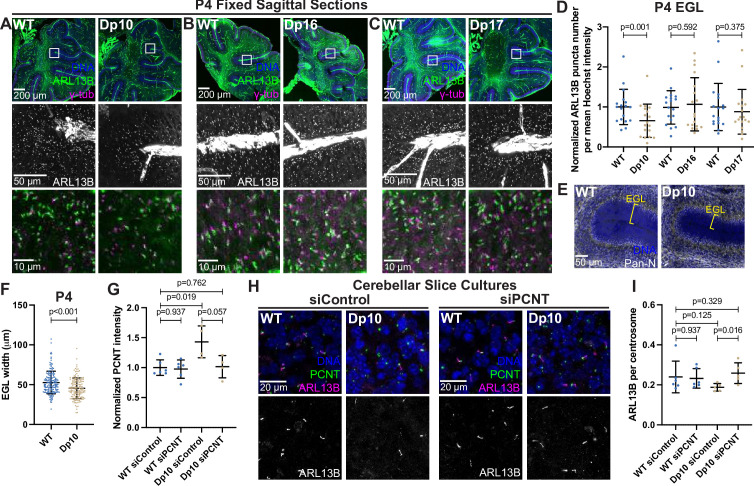
Figure 7—source data 1. Values for biological and technical replicates for graphs in Figure 7 and Figure 7—figure supplement 1.

Figure 7.

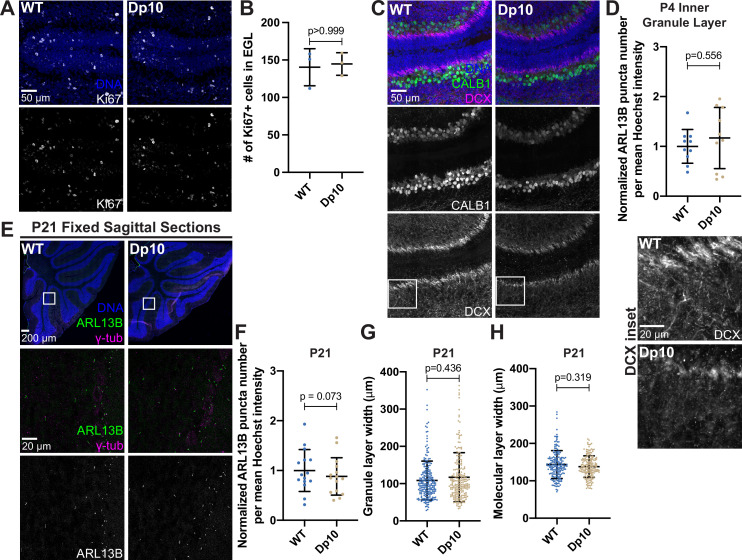
Figure 7—figure supplement 1. Normal proliferation and P21 mouse cerebella morphology and defective Doublecortin labeled microtubule extensions.

Figure 7—figure supplement 1.

(A) Representative tiled confocal images of WT and Dp10 P4 animals corresponding to the same cerebellar folia in each animal. Brain sections were stained with Hoechst 33342 and the cell proliferation marker Ki67. (B) Quantitation of the number of Ki67-positive cells in the external granular layer of WT and Dp10 animals. Graph shows mean ± SD. N=3. Mann-Whitney U test. (C) Representative tiled confocal images of WT and Dp10 P4 animals corresponding to the same cerebellar folia in each animal. Brain sections were stained with Hoechst 33342 and the Purkinje cell marker calbindin (CALB1) and the microtubule binding protein doublecortin (DCX). The far-right panel shows insets of DCX staining. (D) Quantitation of primary cilia frequency in the inner granule layer of WT and Dp10 animals normalized to WT. Graph shows mean ± SD. N=3. Wilcoxon matched-pairs test. (E) Representative tiled confocal images of the cerebellum from P21 wild-type (WT) and Dp10 animals. Brain sections were stained with Hoechst 33342, ARL13B, and γ-tubulin. Insets show zoomed in regions corresponding to the same folia in each animal. (F) Quantitation of primary cilia frequency in WT and Dp animals at P21 normalized to WT at P21. Graph shows mean ± SD. N=3. Wilcoxon matched-pairs test. (G–H) Quantitation of the granular layer (G) and molecular layer (H) widths in WT and Dp10 animals at P21. Graphs show mean ± SD. N=3. Mann-Whitney U test.