
FIGURE 4.
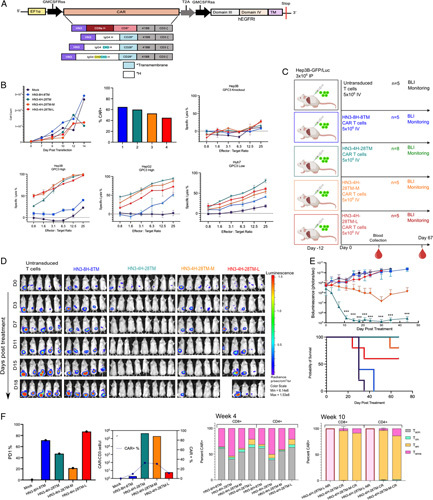
Fc containing CAR T cells do not improve efficacy of engineered CAR T cells in vitro or in vivo. (A) CAR T-cell construct map with Fc containing long (IgG4-CH2CH3H), intermediate (IgG4-CH3H), and short (IgG4H) hinge regions. (B) Cell count monitored over the course of 14 days. Transduction efficiency measured by CAR+ cells at day 8. CAR T cells were cultured with GPC3 expressing HCC cells lines (Hep3B, HepG2, and Huh7) and GPC3 knockout (KO) cells at different effector to target ratios to assess specific lysis. (C) Study diagram if injection (i.p., 3 million), treatment of HCC tumors (i.v., 5 million), and blood collection in an NSG mouse model Intermediate and long hinges containing Fc are indicated by M or L after the construct name. (D) Bioluminescence imaging results quantifying tumor size. (E) Bioluminescence quantification of tumor size. Values represent mean±SEM. million ***p < 0.001; ns, not significant. Survival curve over full course of study (67 days). (F) PD1 indicating exhaustion shows that in all constructs at week 4. Standardized CAR T-cell counts and CAR-positive percentage in all groups at week 4. All listed subsets of T cells were also quantified at 4 and 10 weeks by flow cytometry. CAR, chimeric antigen receptor; PD1, programmed cell death protein 1.