
FIGURE 1.
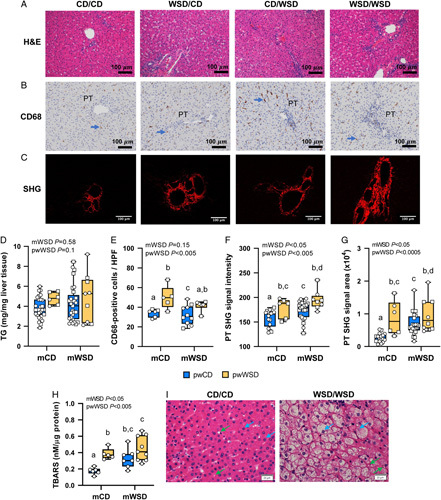
Liver phenotype in 3-year-old offspring. Representative images of hematoxylin and eosin (H&E)-stained livers (A), CD68-positive macrophage (brown) near portal triads (PTs); blue arrows indicate macrophage (B), and second harmonic generation (SHG) images of PTs with SHG signal in red (C). Scale bar: 100 μm. (D) Liver triglyceride (TG) content. (E) Mean number of CD68-positive macrophage per portal area in livers. SHG signal intensity (F) and area (G) in PT regions. (H) Thiobarbituric acid reactive substances (TBARS) content in livers. (I) Representative images from H&E-stained livers showing normal hepatocytes in CD/CD and hepatocyte ballooning in WSD/WSD. Blue arrows indicate hepatocytes and green, HSCs. Scale bar: 20 μm. (D–G) Symbols represent sample numbers per group, squares represent males, circles represent females. (D–H) Two-way ANOVA with effect for maternal (mWSD) and postweaning (pwWSD) diet is shown. Individual posttest comparisons are indicated when maternal, postweaning, or interaction effect are p < 0.05 and different letters represent differences between groups. n = 6–26 CD/CD, n = 10–27 WSD/CD, n = 5–6 CD/WSD, n = 6–9 WSD/WSD. Abbreviations: CD indicates chow diet; WSD, Western-style diet.