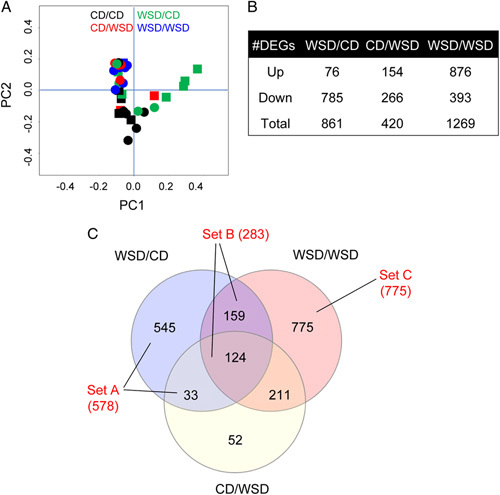
FIGURE 2.

Liver transcriptomic analysis in 3-year-old offspring. (A) Two-dimensional principal component analysis plot showing samples in all diet groups. Black indicates CD/CD, green indicates WSD/CD, red indicates CD/WSD, and blue indicates WSD/WSD; squares indicate male and circles indicate female offspring. (B) The number of differentially expressed genes (DEGs) that are upregulated or downregulated and total DEGs in each group compared with CD/CD. (C) Venn diagram showing overlapping and distinct sets of DEGs. Blue circle indicates DEGs in WSD/CD versus CD/CD, red circle indicates DEGs in WSD/WSD versus CD/CD, yellow circle indicates DEGs in CD/WSD versus CD/CD. DEGs in set A are associated with maternal WSD (mWSD) in the absence of postweaning WSD (pwWSD). DEGs in set B are comprised of DEGs associated with mWSD regardless of postweaning diet. DEGs in set C are associated with mWSD only when combined with pwWSD. n = 10 CD/CD; n = 10 WSD/CD; n = 6 CD/WSD; n = 7 WSD/WSD. Abbreviations: CD indicates chow diet; WSD, Western-style diet.
