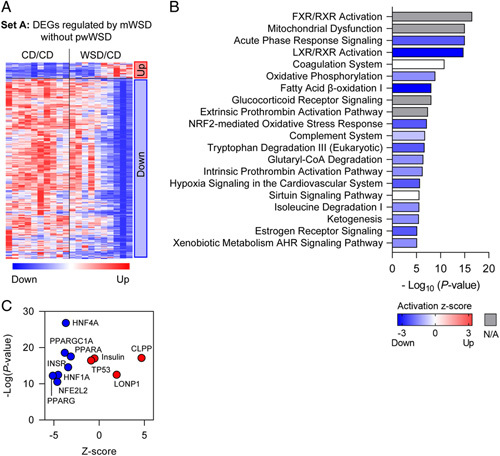
FIGURE 3.

Differentially expressed genes (DEGs) associated with maternal WSD (mWSD) exposure. (A) Clustered heatmap showing upregulated and downregulated genes in set A. (B) Canonical pathways enriched in the DEGs are shown in order by p value. Bar shading indicates the predicted activation Z-score on a scale from highest (red) to lowest (blue), with white representing 0. For some pathways, ingenuity pathway analysis could not assign a Z-score (gray). (C) Predicted upstream regulators plotted with p value (x-axis) and predicted Z-score (y-axis). n = 10 CD/CD; n = 10 WSD/CD. Abbreviations: CD indicates chow diet; WSD, Western-style diet.
