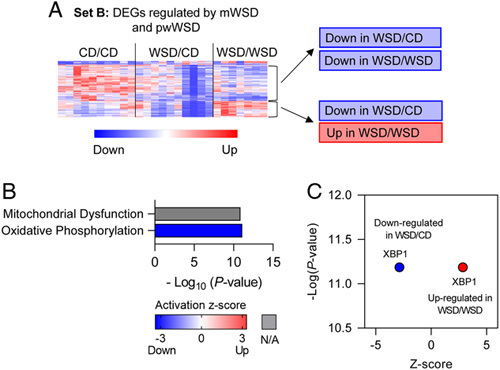
FIGURE 4.

Differentially expressed genes (DEGs) associated with maternal WSD (mWSD) exposure in both postweaning CD (pwCD)and postweaning WSD (pwWSD) groups. (A) Clustered heatmap showing 2 sets of DEGs in set B. One with the same direction of fold change in WSD/CD and WSD/WSD and the other with opposite fold changes between WSD/CD and WSD/WSD. (B) Canonical pathways enriched in the DEGs are shown in order by p value. Bar shading indicates the predicted activation Z-score on a scale from highest (red) to lowest (blue), with white representing 0. For some pathways, ingenuity pathway analysis could not assign a Z-score (gray). (C) Predicted upstream regulator plotted with p value (x-axis) and predicted Z-score (y-axis). n = 10 CD/CD; n = 10 WSD/CD; n = 7 WSD/WSD. Abbreviations: CD indicates chow diet; WSD, Western-style diet.
