Figure 3.

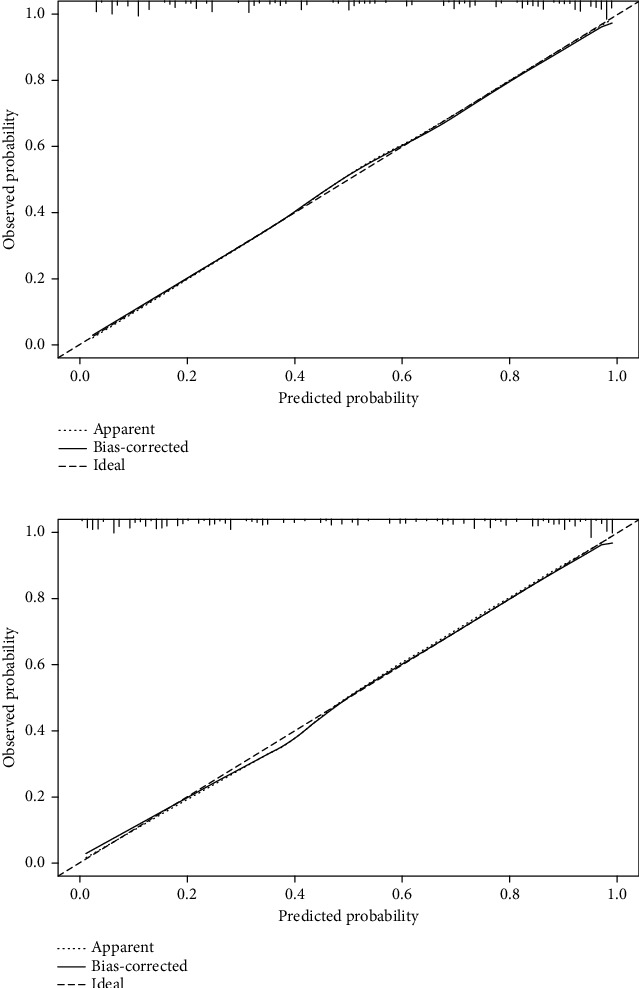
Calibration curves in the training and validation cohorts (a, b). The x-axis shows the model's predicted probability, and the y-axis shows the actual probability.

Calibration curves in the training and validation cohorts (a, b). The x-axis shows the model's predicted probability, and the y-axis shows the actual probability.