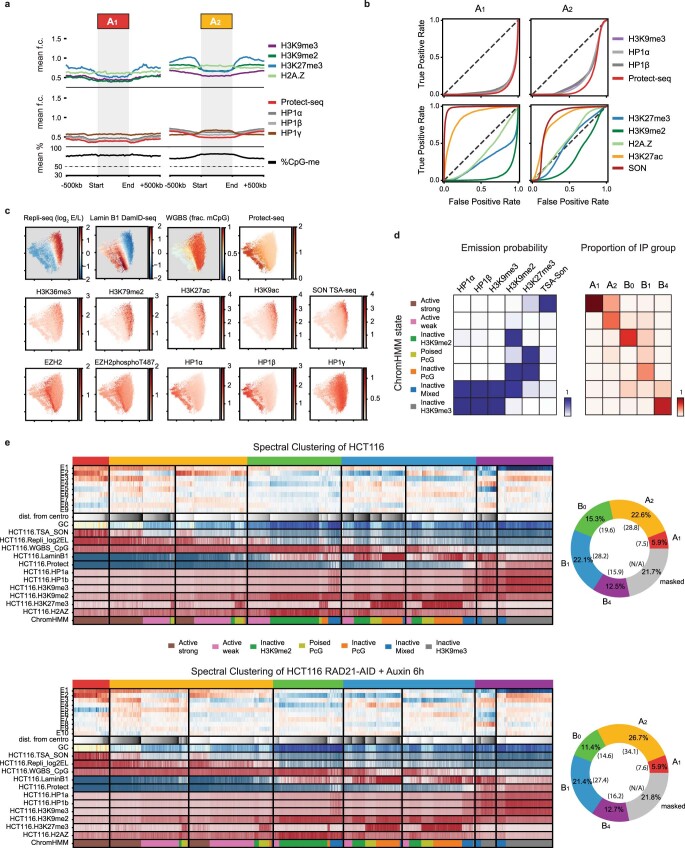
Extended Data Fig. 3. Chromatin state composition of IPGs in HCT116.
(a) Metaplots displaying signal enrichment for the same features as Fig. 2c for A1 and A2 domains. (b) ROC curves assessing the prediction performance of individual 50kb-aggregated functional tracks as binary classifiers as in Fig. 2d but for A1 and A2 loci. Additionally, curves for active marks (ChIP-seq for H3K27ac and TSA-seq for SON) are shown. (c) E1 vs. E2 scatter plots of 50-kb bins colored by point density and ChIP-seq for various factors and histone modifications. (d) Left, emission probabilities for ChromHMM model on five ChIP-seq for repressive marks and SON (TSA-seq for nuclear speckle marker) trained on 50 kb bins. Right, heatmap showing the distributions of ChromHMM state labels found in each IPG (columns). (e) Left, feature heatmaps for spectral clustering on HCT116 (top) and the cohesin-depleted HCT116 RAD21-AID line from (Rao et al.10) (bottom). The tracks displayed are the same as in Fig. 1d but also include various histone marks. Columns (50-kb bins) within each cluster are sorted first by ChromHMM state (as per the model in (D)) and then by distance from centromere. The last row assigns a color to each bin based on its ChromHMM state. When we identify IPGs in Hi-C data from HCT116 cells in which the cohesin subunit RAD21 is depleted, we observe a slight increase in correspondence to ChromHMM labels (Adjusted Rand Index: HCT116 = 0.31, HCT116-RAD21 = 0.35). This is consistent with loop extrusion interfering with innate compartmentalization preferences. Right, donut plots showing hg38 percentage covered by each IPG (top, HCT116; bottom, HCT116 RAD21-AID). Note: translocations and unmappable areas are masked. Percentages excluding translocations and unmappable areas are in parentheses.

