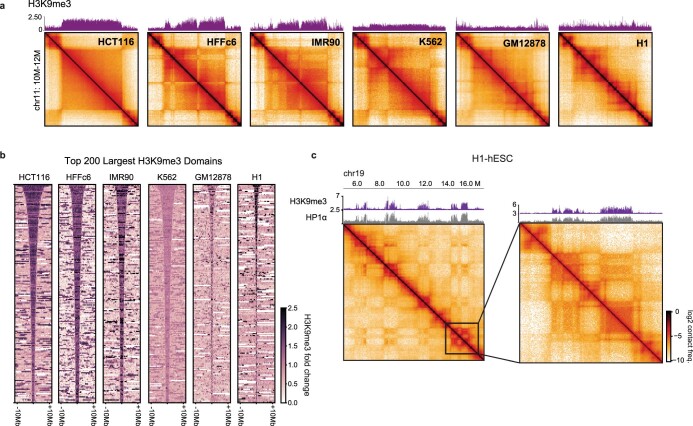
Extended Data Fig. 6. Comparative analysis of H3K9me3 domains.
Comparative analysis of genome organization and heterochromatic marks across HCT116, HFFc6, IMR90, K562, GM12878 and H1-hESC. (a) Expanded example domain across cell types as in Fig. 3e including data for IMR-90 and HFFc6. (b) Stacked signal heatmaps of H3K9me3 signal centered at the top 200 largest H3K9me3 domains detected in six cell types. (c) Example of homotypic interactions at H3K9me3-HP1α domains on chr19 in H1-hESC.

