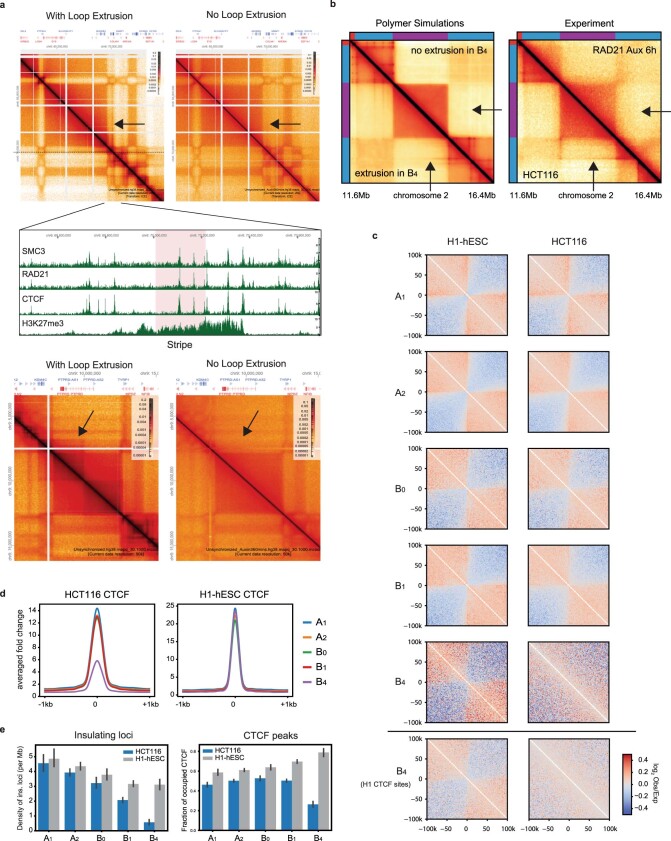
Extended Data Fig. 7. Evidence of loop extrusion but lack of CTCF within heterochromatin domains.
(a) Two examples of cohesin-dependent loop extrusion features traversing a B4 domain. Hi-C maps of HCT116 (left columns) and HCT116-RAD21 auxin depletion (right columns). Arrows indicate loop extrusion features that are dependent on the cohesin complex: stripe (top Hi-C map) and TAD (bottom Hi-C map). Middle panel, ChIP-seq tracks of SMC3, RAD21, CTCF, and H3K27me3 for the stripe (highlighted in pink) and surrounding region (b) Contact frequency maps from in silico polymer simulations (left) compared to experimental Hi-C (right). Arrows indicate a stripe next to a B4 domain that extends parallel to its edge in HCT116. Experimental data is replicated when cohesin traversal is permitted (lower triangle) and does not appear when loop extrusion is blocked at the B4 domain (upper triangle). (c) Average observed/expected maps from HCT116 and H1-hESC Hi-C maps centered at HCT116 CTCF binding sites within each HCT116-defined IPG. Bottom row, same for B4 but using H1-hESC CTCF binding sites. Expected maps are calculated separately for each IPG. (d) Average fold enrichment of CTCF ChIP-seq across all known CTCF sites used in (C) for HCT116 and H1-hESC. (e) Left, density of insulating loci in H1-hESC (4DNFIGDQ72ID) and HCT116 (4DNFIBKY9EG9) cells grouped by HCT116 IPG. Bar heights give the mean CTCF density across all domains belonging to an IPG in each cell type. Error bars represent 95% confidence intervals. n(A1) = 310, n(A2) = 1448, n(B0) = 711, n(B1) = 1333, n(B4) = 382 domains from each IPG. Right, fraction of peaks detected at all known CTCF sites (from Maurano et al.61) occupied in HCT116 (ENCFF171SNH) and H1-hESC (ENCFF692RPA) ChIP-seq grouped by HCT116 IPG. Bars represent the fraction of (Maurano et al.61) CTCF sites occupied per domain in each cell type. Bar heights give the mean fraction occupied across all domains belonging to an IPG. Error bars and n values as on the left.

