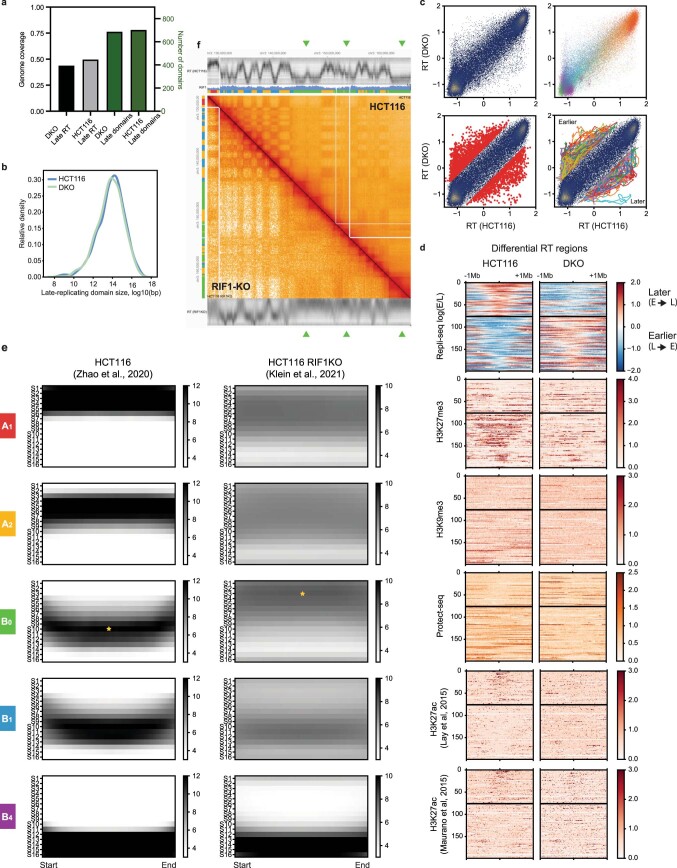
Extended Data Fig. 9. Late replication timing of B0 in HCT116 is RIF1-dependent, while shifts to earlier RT in DKO are associated with loss of H3K27me3.
(a) Total number (green) and genome coverage (black) of late replicating domains detected in HCT116 and DKO using a Gaussian HMM. (b) KDE plots of domain size of late replicating domains (log10) in HCT116 and DKO. (c) Differential replication timing analysis. Top: Left, scatter plot of 50-kb genomic bins based on z-scored Repli-seq log2(Early/Late) in HCT116 vs DKO. Right, same scatter plot colored by IPG label. Bottom: Left, same scatter plot with loci exhibiting a change >= 0.75 highlighted in red. Right, same scatter plot with continuous merged differential regions connected using colored lines. (d) Stacked signal heatmaps centered at differentially replicating regions (not scaled) divided into later/delayed onset (top) and earlier/hastened onset (bottom) regions displaying various signal tracks in HCT116 and DKO cells (n = 199). (e) Aggregate heatmaps of 16-stage Repli-seq from HCT116 (Zhao et al.60) and HCT116 RIF1-KO (Klein et al.56) derived from uniformly scaled IPG domains. Star icons indicate the modal stage in B0 domains: S10 in HCT116 and S3 in HCT116 RIF1-KO. (f) HiGlass view of 16-stage Repli-seq and Hi-C for HCT116 (top right) and RIF1-KO (bottom left). Three B0 regions that shift replication timing from late to early in RIF1-KO are denoted with green arrow heads.

