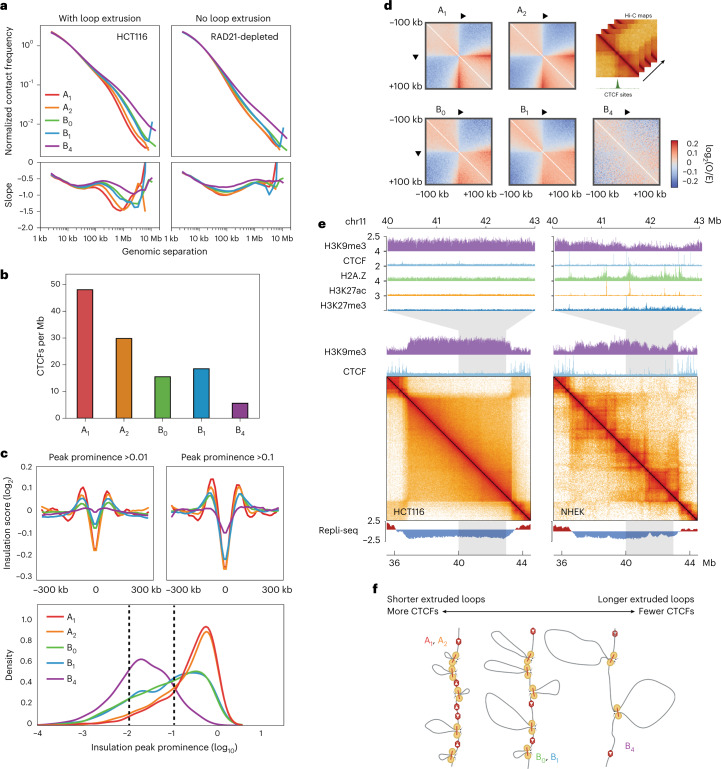
Fig. 4. All IPGs in HCT116 are permissive to loop extrusion but B4 domains lack extrusion barriers.
a, Top, P(s) curves, or interaction frequency as a function of genomic distance, for HCT116 and cohesin-depleted HCT116 RAD21-AID Hi-C, restricted to A1 (red), A2 (orange), B0 (green), B1 (blue), B4 (violet), normalized to unity at s = 10 kb. Bottom, derivative of P(s) indicating average sizes of extruded loops regardless of appearance of dots and stripes in Hi-C data. b, Mean number of CTCF peaks per megabase in each IPG. c, Top, average insulation score (log2) centered on 25-kb insulating loci (diamond size 100 kb) with peak prominence score (Methods) greater than or equal to 0.01 (left) and 0.1 (right) per IPG. Bottom, kernel density estimation plots of the insulation peak prominence (log10) distribution in each IPG. Dashed lines indicate cutoffs for insulating loci used in panels above (>0.01 and >0.1 peak prominence). d, Average observed/expected Hi-C maps around CTCF binding sites within each IPG, centered at CTCF motifs oriented as indicated. Expected maps are calculated separately for each IPG. e, Contact frequency maps of a 9-Mb genomic region containing a B4 domain in HCT116 (chr11:35.5–44.5 Mb) and the same region in NHEKs along with tracks for H3K9me3 and CTCF ChIP–seq above, and two-stage Repli-seq below. Top, magnifications of a 3-Mb subregion showing tracks for H3K9me3, CTCF, H2A.Z, H3K27ac and H3K27me3. f, Model of extrusion barrier (CTCF) sparsity determining the average extruded loop size as reflected in the P(s) shoulder for each IPG, with B4 domains having the fewest barriers and longest extruded loops.

