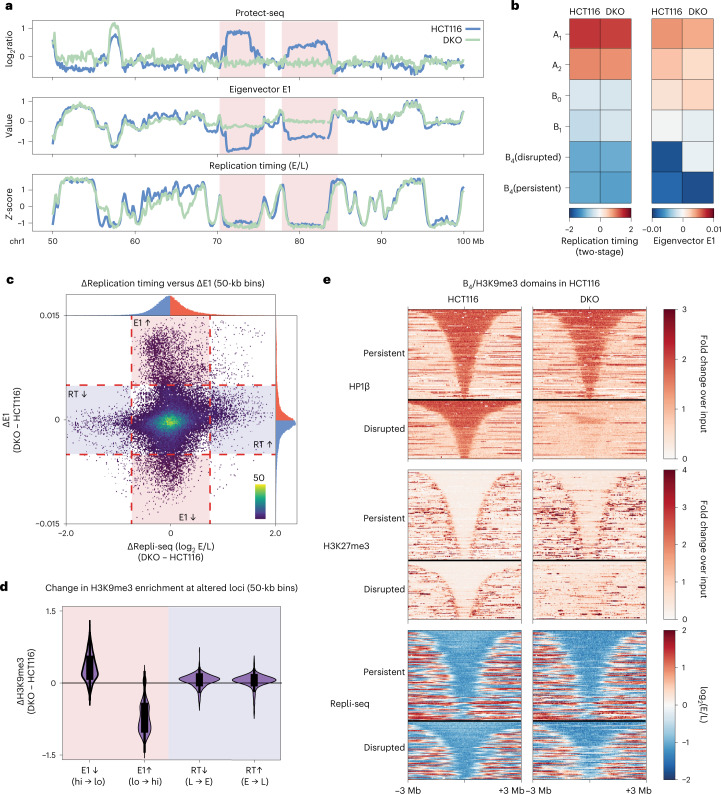
Fig. 6. Loss or gain of H3K9me3-HP1α/β is not correlated with replication timing alterations.
a, Example region (chr1:50–100 Mb) containing two disrupted domains in HCT116 cells (light blue) and DKO cells (light green) illustrating dramatic changes in compartmentalization without changes in replication timing. Top, Protect-seq signal track (log2 signal/input). Middle, eigenvector track (E1). Bottom, two-stage Repli-seq shown as Z-score of log2(Early/Late). b, Heatmaps of mean signal of Repli-seq (left) and E1 (right) over 50-kb bins per IPG in HCT116 and DKO. c, Scatter plot of change in E1 score versus change in Repli-seq signal for 50-kb bins (DKO − HCT116). Tail areas of uncorrelated variation of E1 and replication timing are gated and shaded. d, Violin plots quantifying changes in H3K9me3 (DKO − HCT116) over groups of altered 50-kb bins depicted in c: decreased E1 score in DKO (n = 2,167 bins), increased E1 score in DKO (n = 3,246), decreased Early/Late signal in DKO (delayed replication timing, n = 932), increased Early/Late signal in DKO (hastened replication timing, n = 1,501). Box extents give the interquartile range with whiskers extending by a factor of 1.5. e, Stacked signal heatmaps of HP1β ChIP–seq, H3K27me3 ChIP–seq and Repli-seq in HCT116 (left) and DKO (right) centered at persistent (top) and disrupted (bottom) B4 domains sorted vertically by size and flanked by ±3 Mb. E/L, Early/Late; RT, replication timing.

